
AI careers are not easy to navigate. Read my blog post for foolproof advice for those interested in building a career in AI.
Tag Archives: data abstraction
12
Apr
Apr
Statistics trivia for data scientists will refresh your memory from the courses you’ve taken – or maybe teach you something new! Visit my blog to find out!
07
Mar
Mar
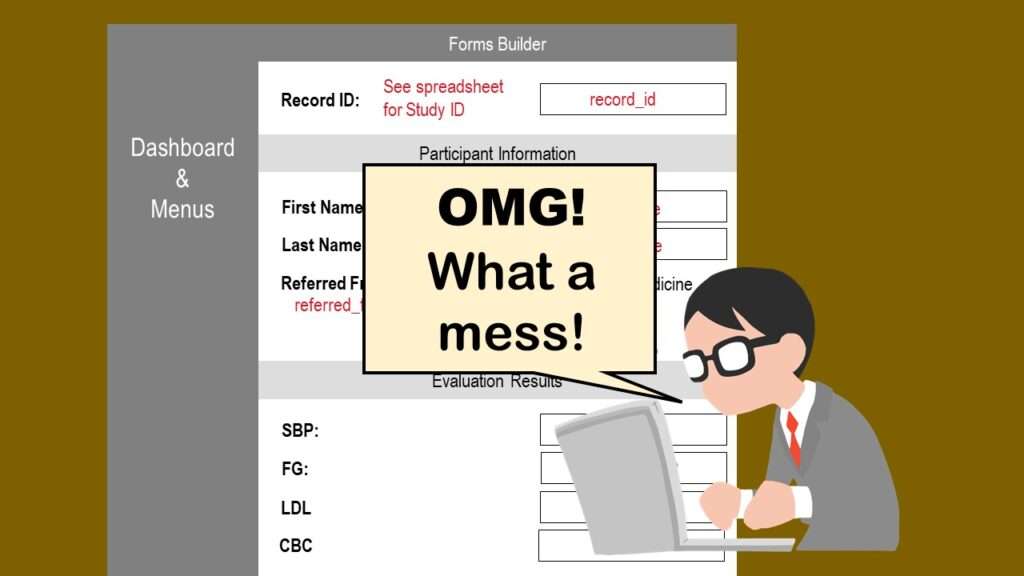
REDCap mess happens often in research shops, and it’s an analysis showstopper! Read my blog post to learn my secret tricks for breaking through the barriers and getting on with data analytics!

11
Apr
Apr
Time series plots in R are totally customizable using the ggplot2 package, and can come out with a look that is clean and sharp. However, you usually end up fighting with formatting the x-axis and other options, and I explain in my blog post.

08
Apr
Apr
Data curation solution that I posted recently with my blog post showing how to do upset plots in R using the UpSetR package was itself kind of a masterpiece. Therefore, I thought I’d dedicate this blog post to explaining how and why I did it.
25
Mar
Mar
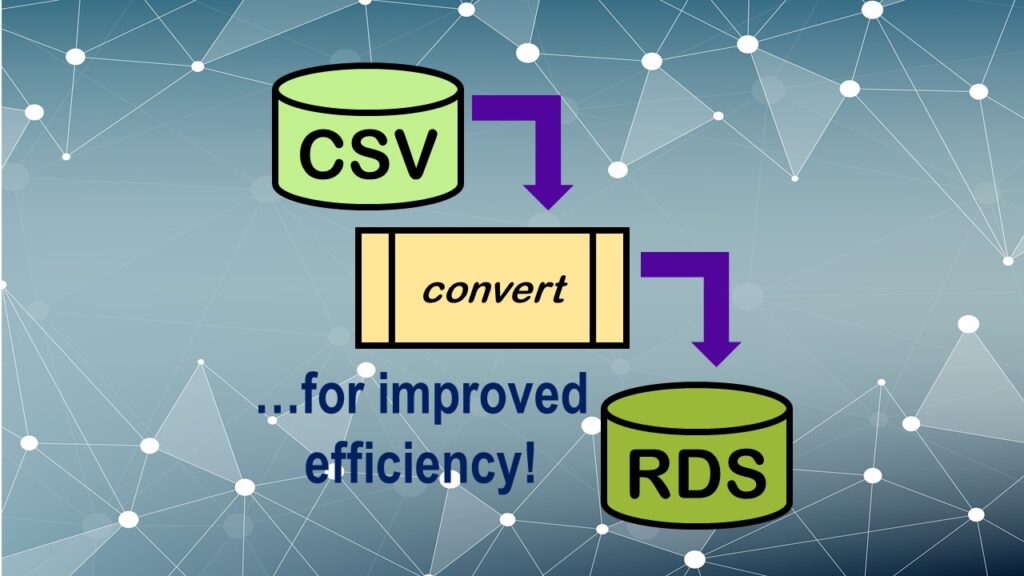
Convert CSV to RDS is what you want to do if you are working with big data files in R GUI and want to improve efficiency. Read my blog post for an explanation and video demonstrations of this process!

18
Feb
Feb
GPower case example shows a use-case where we needed to select an outcome measure for our study, then do a power calculation for sample size required under different outcome effect size scenarios. My blog post shows what I did, and how I documented/curated the results.
16
Feb
Feb
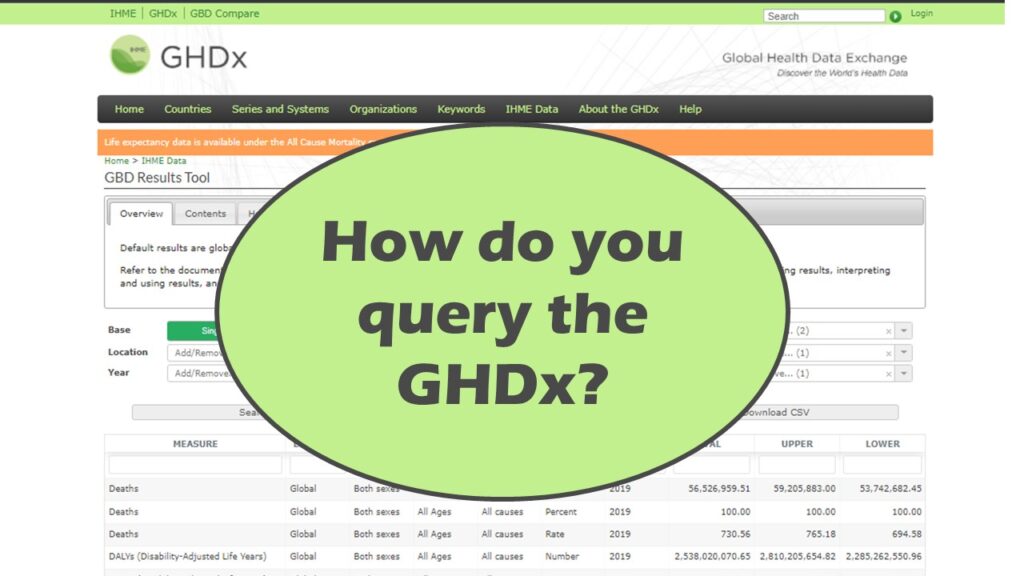
Querying the GHDx database is challenging because of its difficult user interface, but mastering it will allow you to access country-level health data for comparisons! See my demonstration!
14
Jan
Jan
Counting rows in SAS and R is approached differently, because the two programs process data in different ways. Read my blog post where I describe both ways.
07
Jan
Jan
Native formats in SAS and R of data objects have different qualities – and there are reasons behind these differences. Learn about them in this blog post!
- 1
- 2