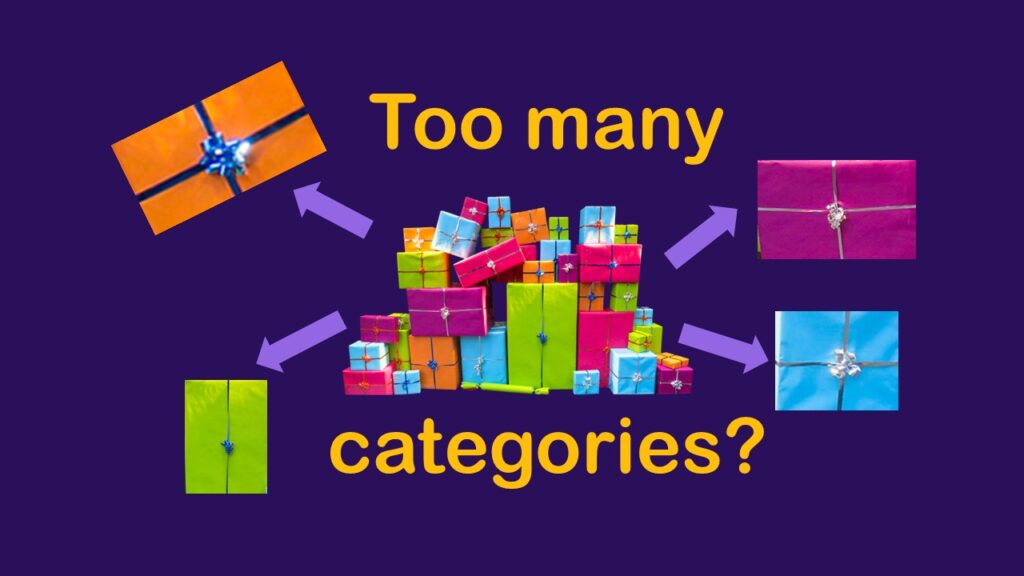
Classification crosswalks are easy to make, and can help you reduce cardinality in categorical variables, making for insightful data science portfolio projects with only descriptive statistics. Read my blog post for guidance!
Tag Archives: college student
02
Nov
Nov
NHANES data piqued your interest? It’s not all sunshine and roses. Read my blog post to see the pitfalls of NHANES data, and get practical advice about using them in a project.
01
Oct
Oct
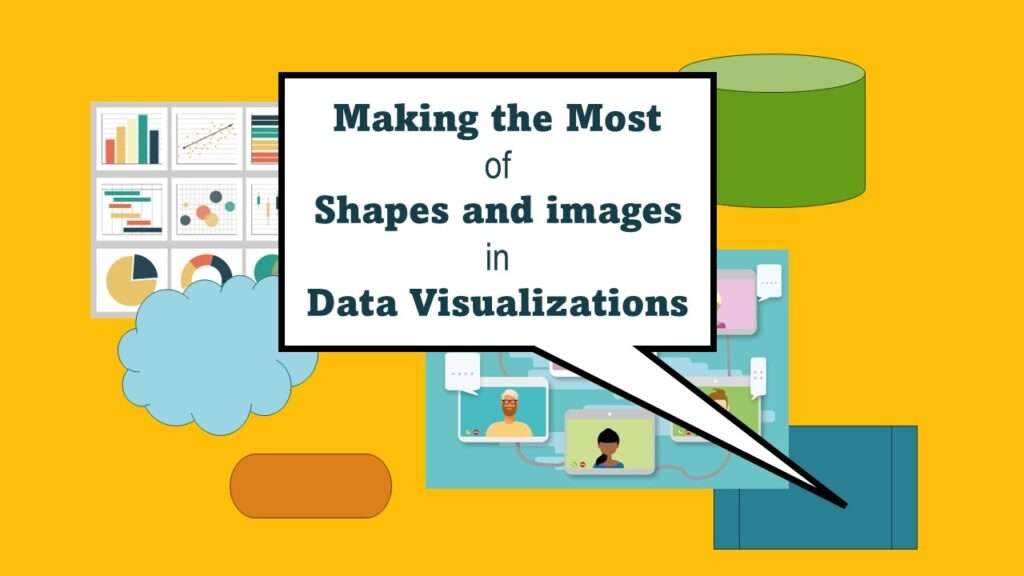
Shapes and images in dataviz, if chosen wisely, can greatly enhance the communicative value of the visualization. Read my blog post for tips in selecting shapes for data visualizations!

13
Jul
Jul
Portfolio project examples are sometimes needed for newbies in data science who are looking to complete independent projects. This blog post provides some great examples of independent projects you can do with datasets available online!

10
Jul
Jul
Internship strategy for data science is not obvious, and even if you are in a college program, they often expect you to find your own internship. Download our internship strategy guide and get the experience you want!

19
Jun
Jun
Understanding legacy data is necessary if you want to analyze datasets that are extracted from old systems. This knowledge is still relevant, as we still use these old systems today, as I discuss in my blog post.
07
Mar
Mar
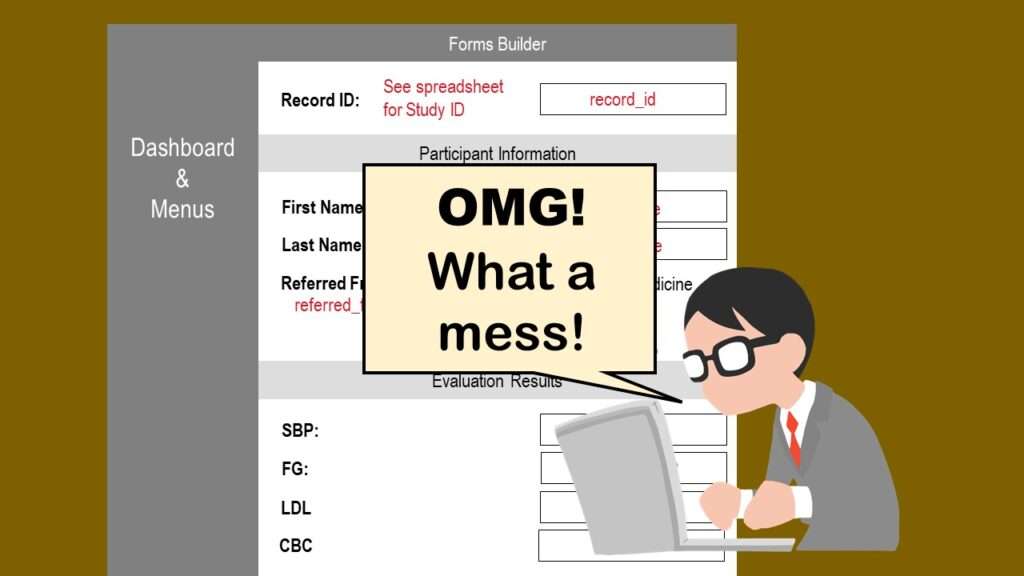
REDCap mess happens often in research shops, and it’s an analysis showstopper! Read my blog post to learn my secret tricks for breaking through the barriers and getting on with data analytics!

29
Apr
Apr
You may already know that NACCHO is NOT cheese – but what is it? It’s a professional society for local public health officials. Read my blog post to learn what NACCHO does, and who it serves.
08
Apr
Apr
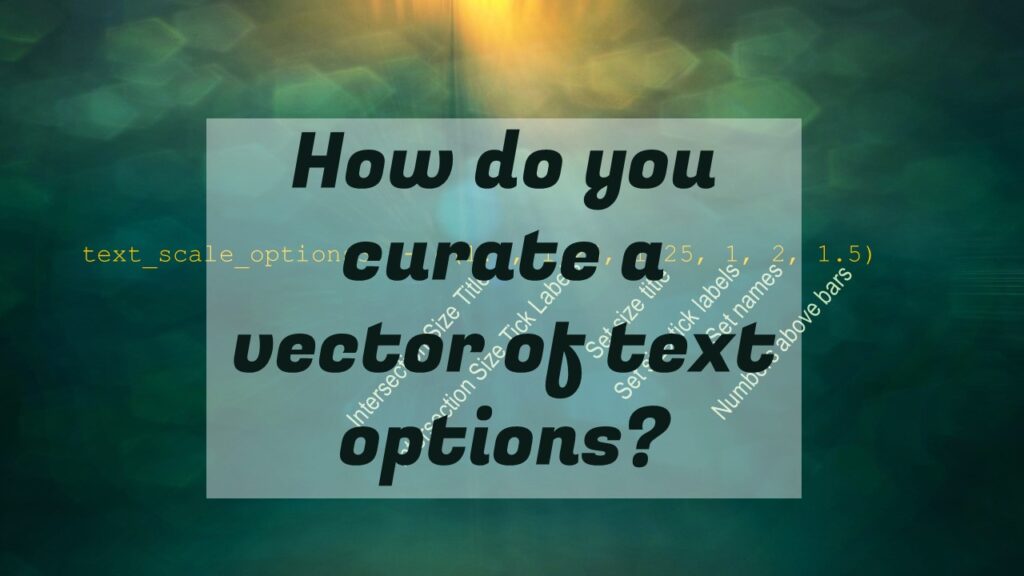
Data curation solution that I posted recently with my blog post showing how to do upset plots in R using the UpSetR package was itself kind of a masterpiece. Therefore, I thought I’d dedicate this blog post to explaining how and why I did it.
07
Jan
Jan
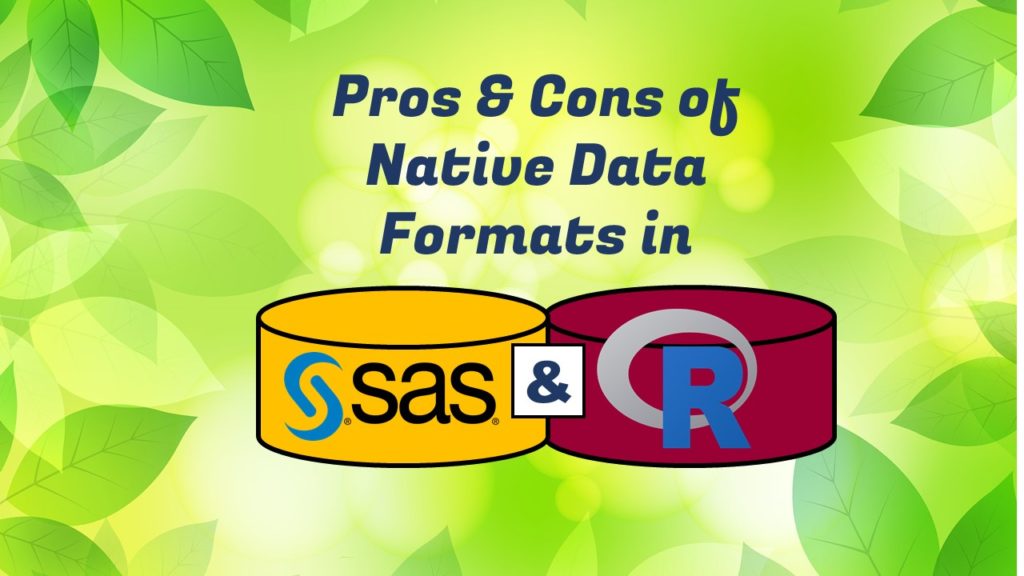
Native formats in SAS and R of data objects have different qualities – and there are reasons behind these differences. Learn about them in this blog post!
- 1
- 2