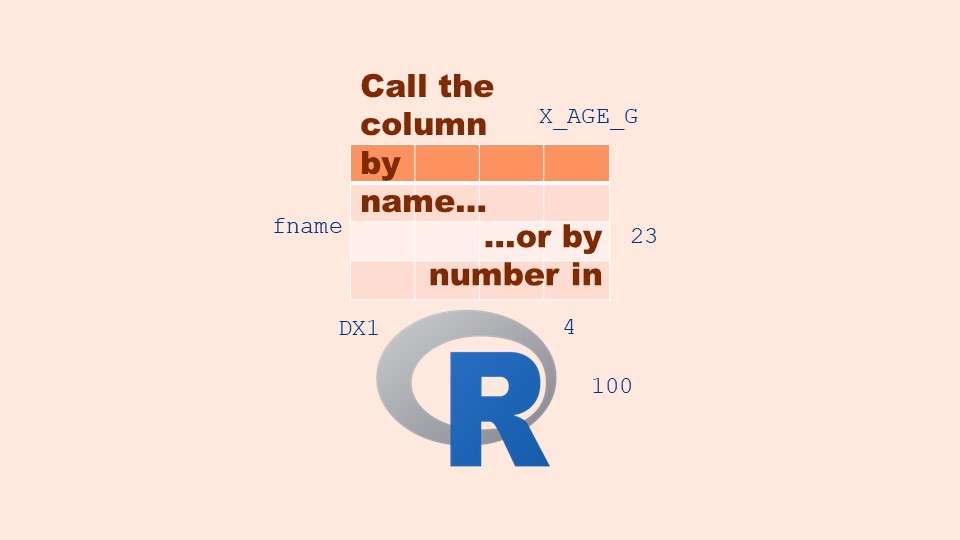
Referring to columns in R can be done using both number and field name syntax. Although field name syntax is easier to use in programming, my blog demonstrates how you can use column numbers to make automation easier.
Monthly Archives: October 2022
12
Oct
Oct
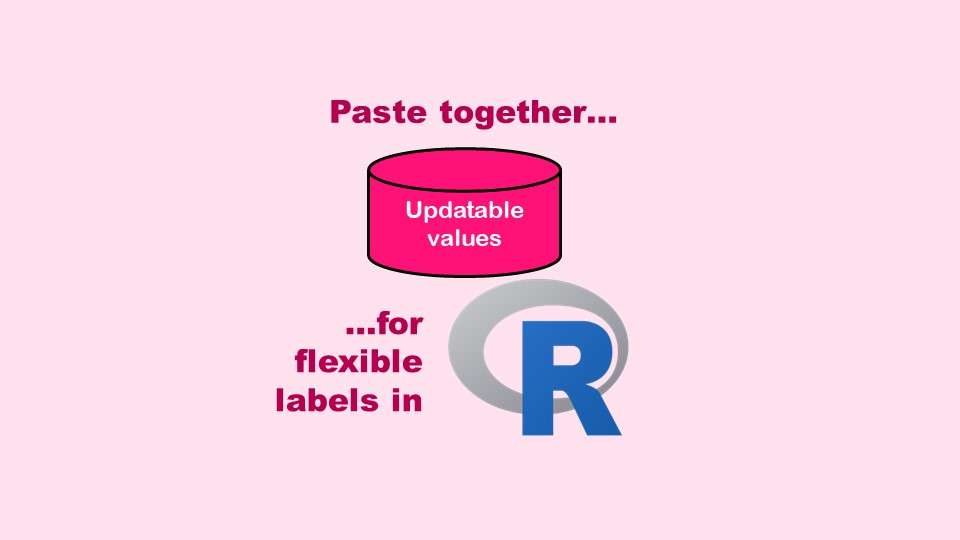
The paste command in R is used to concatenate strings. You can leverage the paste command to make refreshable label objects for reports and plots, as I describe in my blog post.

11
Oct
Oct
Recoloring plots in R? Want to learn how to use an image to inspire R color palettes you can use in ggplot2 plots? Read my blog post to learn how.

11
Oct
Oct
Adding error bars to ggplot2 in R plots is easiest if you include the width of the error bar as a variable in your plot data. Read my blog post to see an example.

08
Oct
Oct
Data science culture is much faster-paced than the more academic and governmental culture in the public health field. Read my blog post for recommendations as to how public health practitioners can overcome the culture clash!