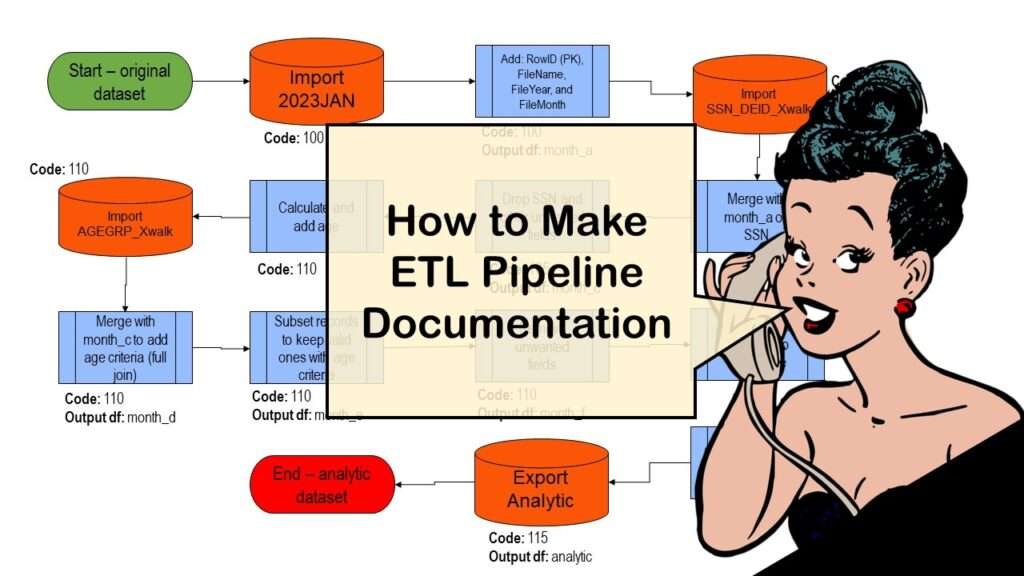
ETL pipeline documentation is great for team communication as well as data stewardship! Read my blog post to learn my tips and tricks.
Tag Archives: YouTube discussion

11
Oct
Oct
Adding error bars to ggplot2 in R plots is easiest if you include the width of the error bar as a variable in your plot data. Read my blog post to see an example.