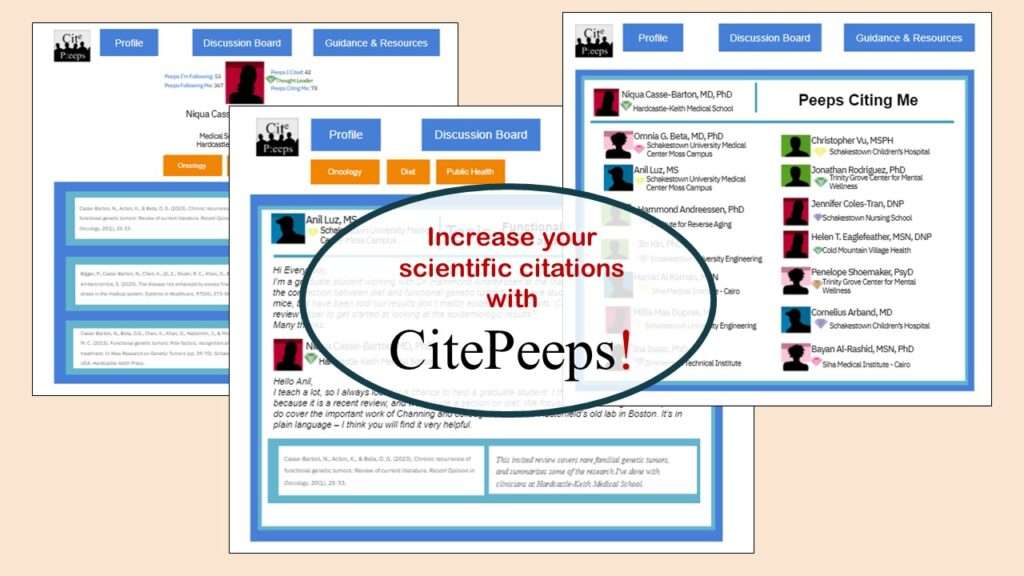
CitePeeps is a new online community of scientific authors focused on increasing the number of citations to their published works. Join us!
Tag Archives: opinion research
22
Feb
Feb
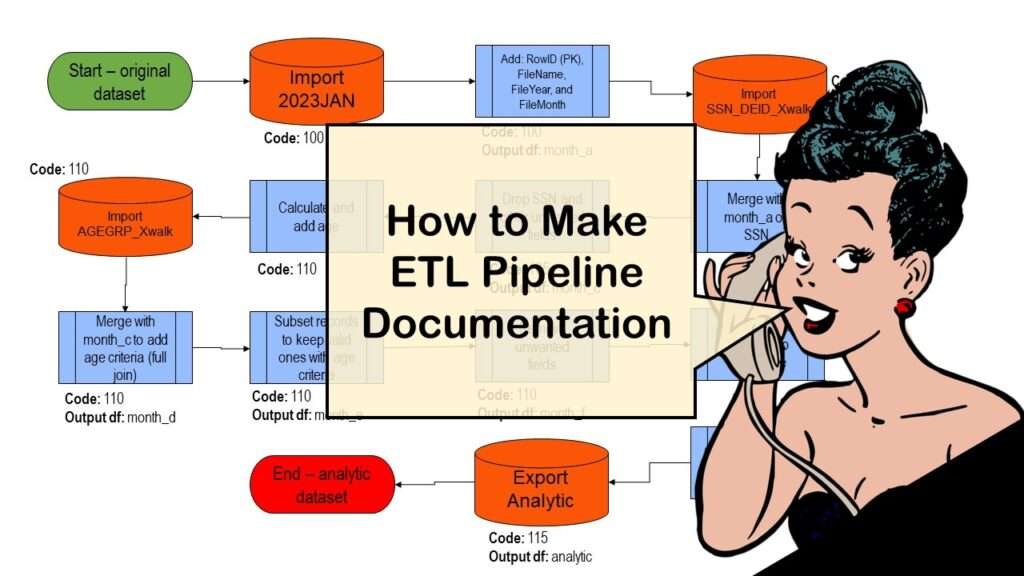
ETL pipeline documentation is great for team communication as well as data stewardship! Read my blog post to learn my tips and tricks.

22
Nov
Nov
Wiley’s predatory behavior recently with a colleague’s scientific manuscript makes me want to avoid publishing in their journals. Read about our experience.
20
Apr
Apr
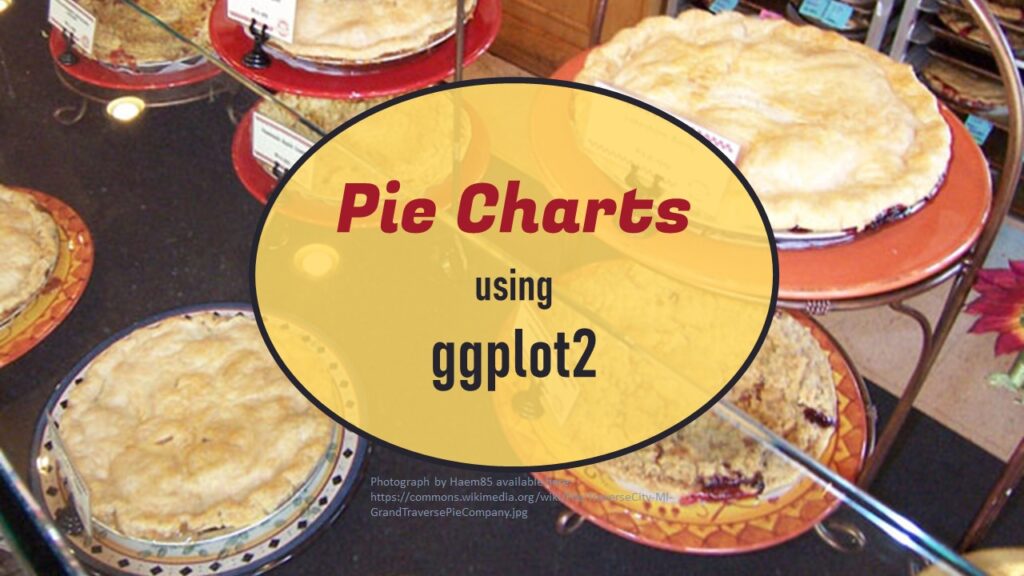
Pie chart ggplot style is surprisingly hard to make, mainly because ggplot2 did not give us a circle shape to deal with. But I explain how to get around it in my blog pot.

16
Mar
Mar
Wondering what we mean by the National Institutes of Health (NIH)? In my blog post, I explain the NIH’s role in appropriating funding for research, and demystify its role in implementing federal priorities.

18
Feb
Feb
GPower case example shows a use-case where we needed to select an outcome measure for our study, then do a power calculation for sample size required under different outcome effect size scenarios. My blog post shows what I did, and how I documented/curated the results.
11
Oct
Oct
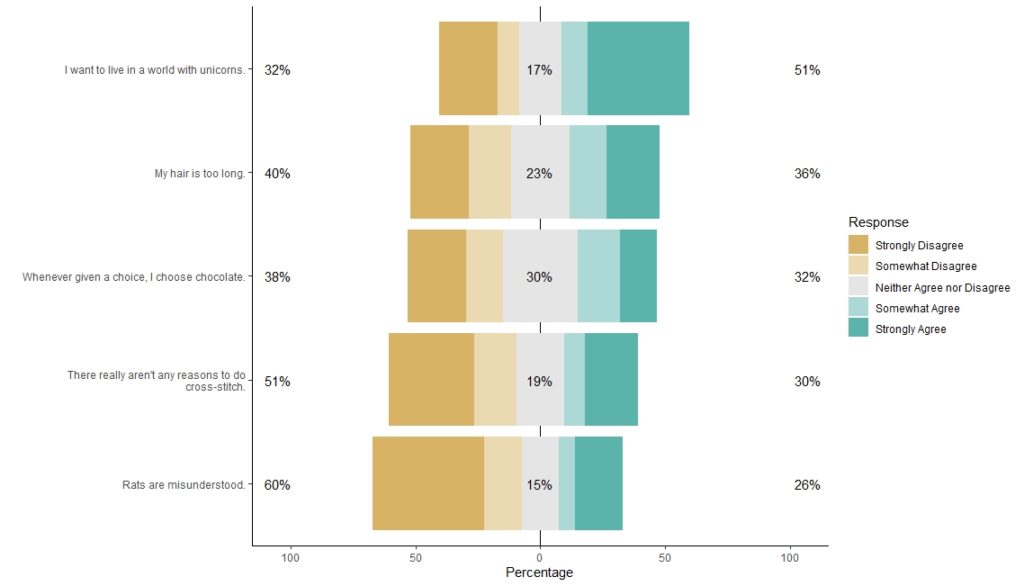
I love the Likert package in R, and use it often to visualize data. The problem is that sometimes, I have sparse data, and this can cause problems with the package. This blog post shows you a workaround, and also, a way to format the final plot that I think looks really great!