Tag Archives: programming lessons

AI on the Edge: What it is, and Data Storage Challenges it Poses

AI on the edge refers to doing the AI processing and equations at the site of the object collecting the data.

“AI on the edge” was a new term for me that I learned from Marc Staimer, founder of Dragon Slayer Consulting, who was interviewed in a podcast. Marc explained how AI on the edge poses a data storage problem, and my blog post proposes a solution!

US Public Health Alphabet Soup Explained: What is the MHS?

The MHS stands for Military Health System, and is the healthcare part of the military.

“What is the MHS?” is a question not always asked by public health data scientists, but it should be. The MHS – or Military Health System – serves the US military through healthcare facilities in locations where civilians do not have access. I provide an explanation on my blog post.

Making Upset Plots with R Package UpSetR Helps Visualize Patterns of Attributes

If you are having trouble setting options using R making plots, then you should read this blog post.

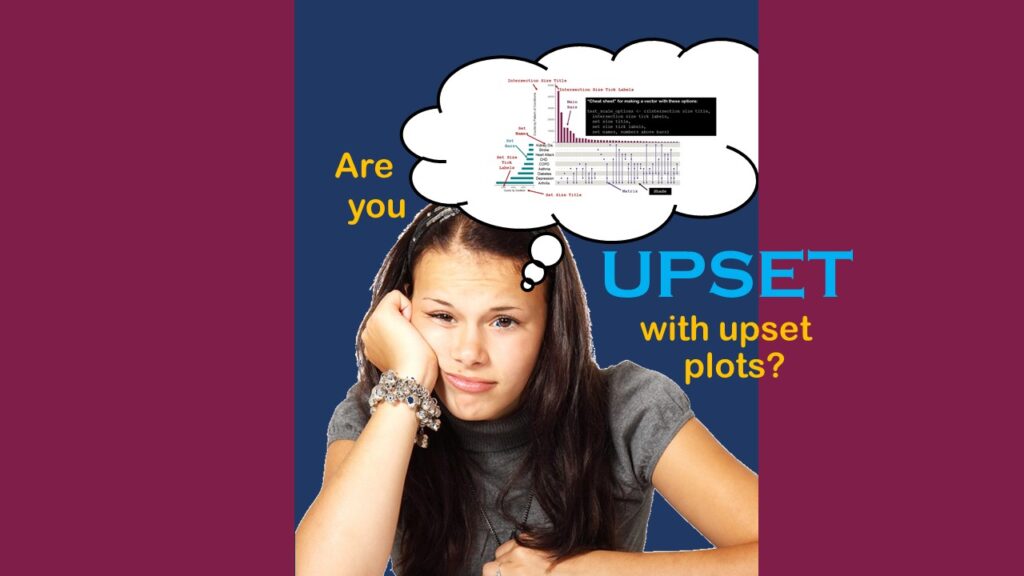
Making upset plots with R package UpSetR is an easy way to visualize patterns of attributes in your data. My blog post demonstrates making patterns of co-morbidities in health survey respondents from the BRFSS, and walks you through setting text and color options in the code.

Making Box Plots Different Ways is Easy in R!

There are two main ways to make box plots in R, and this blog post shows you how, and explains the differences.

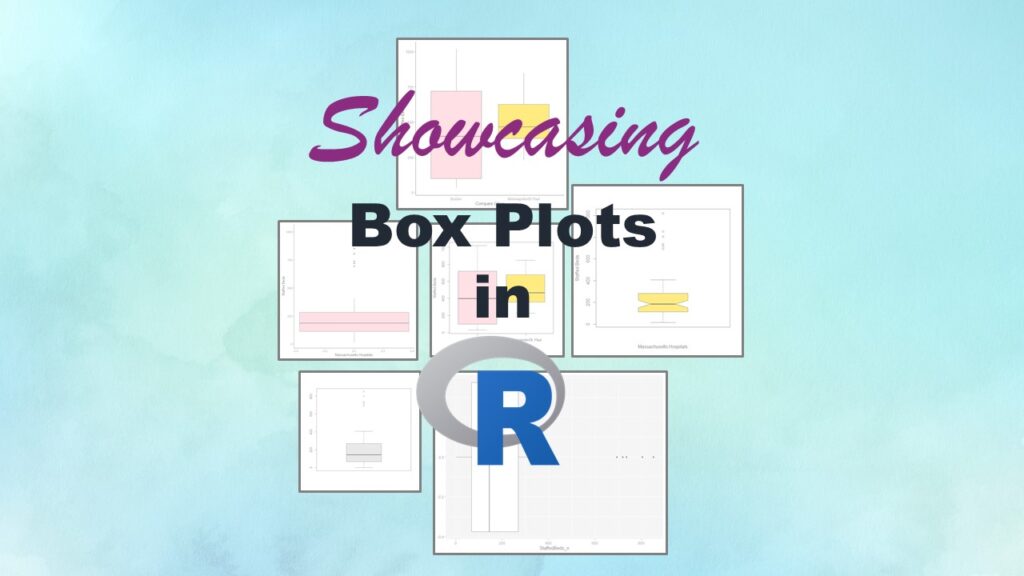
Making box plots in R affords you many different approaches and features. My blog post will show you easy ways to use both base R and ggplot2 to make box plots as you are proceeding with your data science projects.

Convert CSV to RDS When Using R for Easier Data Handling

If you want to use R for a project and the source CSV is very big, it can improve input/output efficiency to convert the file to an RDS.

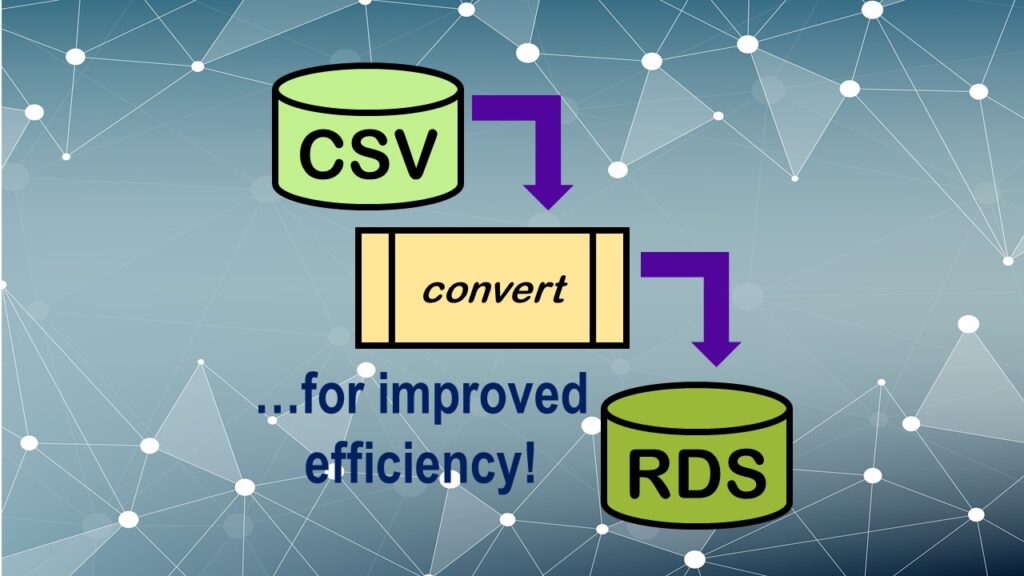
Convert CSV to RDS is what you want to do if you are working with big data files in R GUI and want to improve efficiency. Read my blog post for an explanation and video demonstrations of this process!

GPower Case Example Shows How to Calculate and Document Sample Size

This case example shows a use case where we estimated sample size in GPower under different conditions.

GPower case example shows a use-case where we needed to select an outcome measure for our study, then do a power calculation for sample size required under different outcome effect size scenarios. My blog post shows what I did, and how I documented/curated the results.

Variable Names in SAS and R Have Different Restrictions and Rules

You need to come up with names of variables in SAS and in R, but they need to be compatible with both languages if you are running a data warehouse.

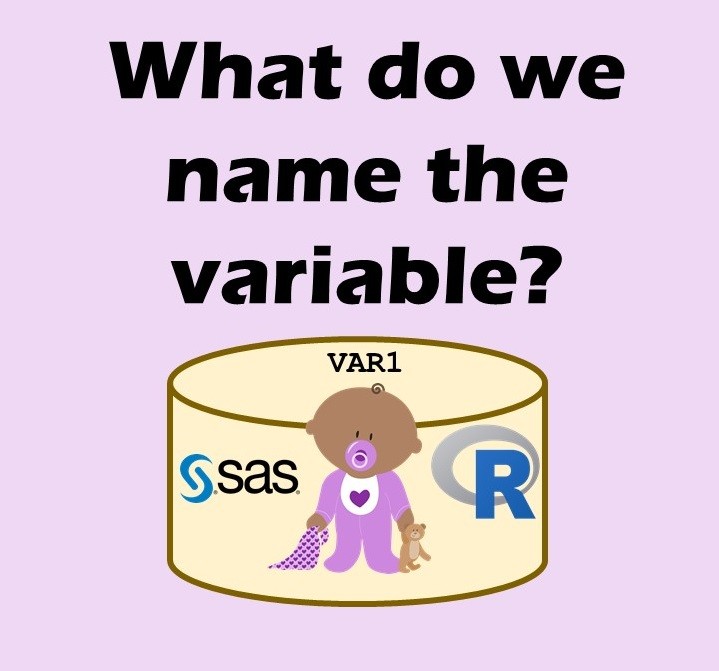
Variable names in SAS and R are subject to different “rules and regulations”, and these can be leveraged to your advantage, as I describe in this blog post.

Native Formats in SAS and R for Data Are Different: Here’s How!

Why use particular data formats for different programming languages in statistics? Because the programs can then process the data faster and with more accuracy.

Native formats in SAS and R of data objects have different qualities – and there are reasons behind these differences. Learn about them in this blog post!

Learn to Use SAS ODA (OnDemand for Academics) in my FREE Online Course!

Want to learn SAS, but not working at a SAS shop? Has your university SAS access expired? Don’t panic – you can use SAS for free online! It may sound unbelievable, but it’s true! You can register for a free account on the SAS OnDemand for Academics (ODA) platform, and practice your SAS for free!

Want to get started with SAS, but don’t want the headache? I make it easy for you! Take my FREE course in getting started with SAS ODA!

Verified by MonsterInsights