Tag Archives: Microsoft Powerpoint

FAERS Data: Getting Creative with an Adverse Event Surveillance Dashboard

Want to learn more about pharmacy data? You can use adverse event data in a data science portfolio project.

FAERS data are like any post-market surveillance pharmacy data – notoriously messy. But if you apply strong study design skills and a scientific approach, you can use the FAERS online dashboard to obtain a dataset and develop an enlightening portfolio project. I show you how in my blog post!

Color in Visualizations: Using it to its Full Communicative Advantage

When using big data, you will want to make visualizations. How do you use color to the greatest communicative advantage?

Color in visualizations of data curation and other data science documentation can be used to enhance communication – I show you how!

Text and Arrows in Dataviz Can Greatly Improve Understanding

Adding text and arrows to diagrams can help your audience navigate the image, and understand what you are trying to communicate.

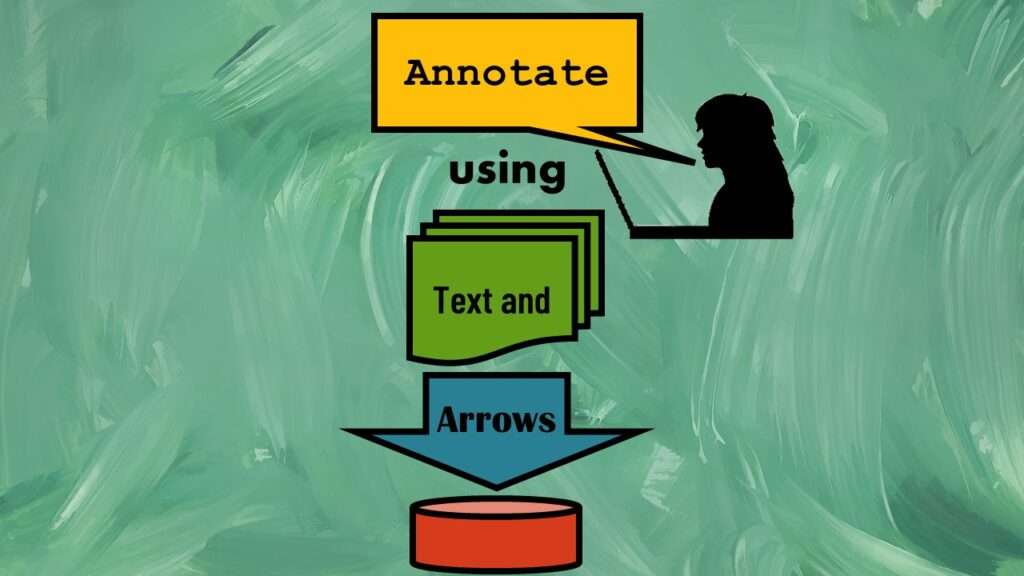
Text and arrows in dataviz, if used wisely, can help your audience understand something very abstract, like a data pipeline. Read my blog post for tips in choosing images for your data visualizations!

Ask Me Anything About Data Science or Public Health!

If you want expert consultation every month from a professor, leader, and data scientist, then we have the perfect service for you.

Ask me anything about data science or public health every month! Subscribe to my “Ask Me Anything” membership, and get all your questions answered in real time!

Rapid Application Development Public Health Style

If you work on front-ends or back-ends of health applications, you are probably already familiar with the concepts of Agile and rapid application development.

“Rapid application development” (RAD) refers to an approach to designing and developing computer applications. In public health and healthcare, we are not taught about application development – but it’s good for us to learn about it, since we have to deal with data from health applications. My blog post talks about the RAD approach I […]

US Public Health Alphabet Soup Explained: What is the ONC?

Before the ONC office was established in 2009, there was no federal oversight of medical record systems.

“What is the ONC?” is what I used to ask before I realized it involves health technology. Although ONC just means “Office of the National Coordinator”, this agency is now known as HealthIT.gov, as I explain in my blog post.

Time Series Plots in R Using ggplot2 Are Ultimately Customizable

Time series plots can be customized if you use package ggplot2 in R. You can place labels and configure axes.

Time series plots in R are totally customizable using the ggplot2 package, and can come out with a look that is clean and sharp. However, you usually end up fighting with formatting the x-axis and other options, and I explain in my blog post.

Convert CSV to RDS When Using R for Easier Data Handling

If you want to use R for a project and the source CSV is very big, it can improve input/output efficiency to convert the file to an RDS.

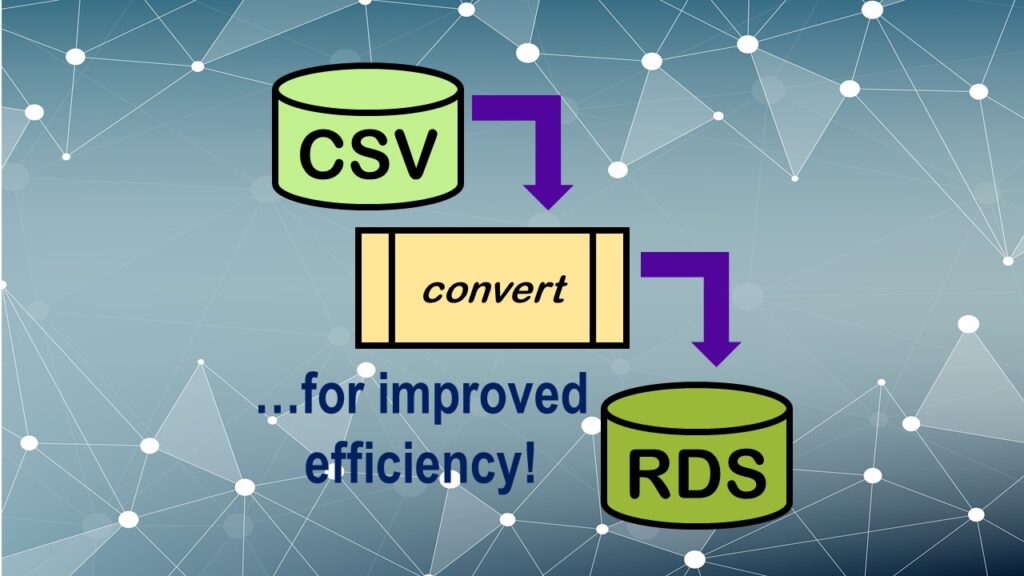
Convert CSV to RDS is what you want to do if you are working with big data files in R GUI and want to improve efficiency. Read my blog post for an explanation and video demonstrations of this process!

SAS-R Integration Example: Transform in R, Analyze in SAS!

You can use SAS and R together in one project. I show you how to develop an analytic dataset in R and put it in SAS ODA for analysis.

Looking for a SAS-R integration example that uses the best of both worlds? I show you a use-case where I was in a hurry, and did transformation in R with the analysis in SAS!

Data Science of Data Collection: Free Course and Course Series!

Take this free online course in the data science of data collection to further your career

Learn the “data science of data collection” through my free introductory course! If you want to learn more, continue with the whole six-course series. Great for graduate students and QA/QI professionals!

Verified by MonsterInsights