Tag Archives: work wellness

Text and Arrows in Dataviz Can Greatly Improve Understanding

Adding text and arrows to diagrams can help your audience navigate the image, and understand what you are trying to communicate.

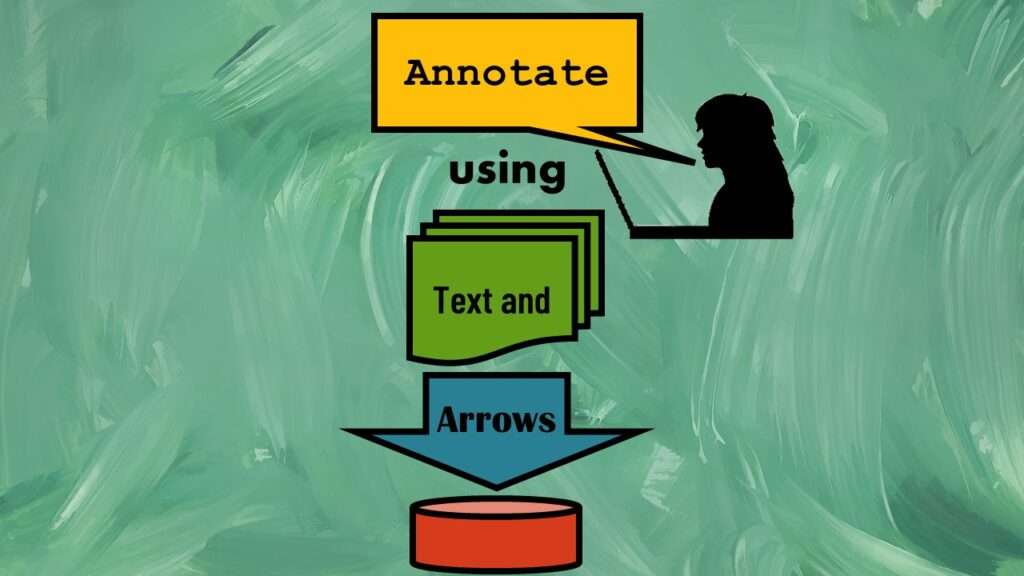
Text and arrows in dataviz, if used wisely, can help your audience understand something very abstract, like a data pipeline. Read my blog post for tips in choosing images for your data visualizations!

Ask Me Anything About Data Science or Public Health!

If you want expert consultation every month from a professor, leader, and data scientist, then we have the perfect service for you.

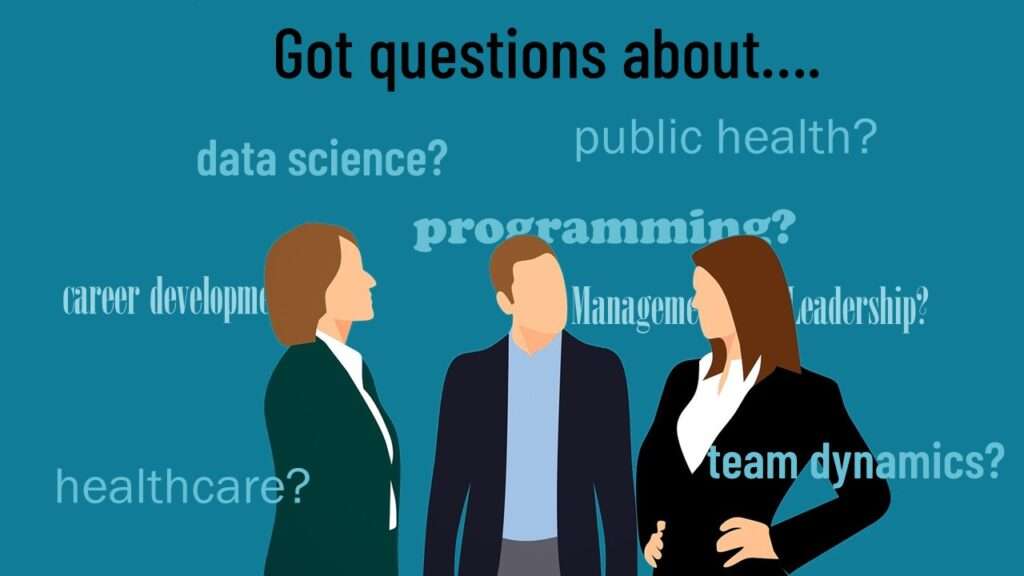
Ask me anything about data science or public health every month! Subscribe to my “Ask Me Anything” membership, and get all your questions answered in real time!

Rapid Application Development Public Health Style

If you work on front-ends or back-ends of health applications, you are probably already familiar with the concepts of Agile and rapid application development.

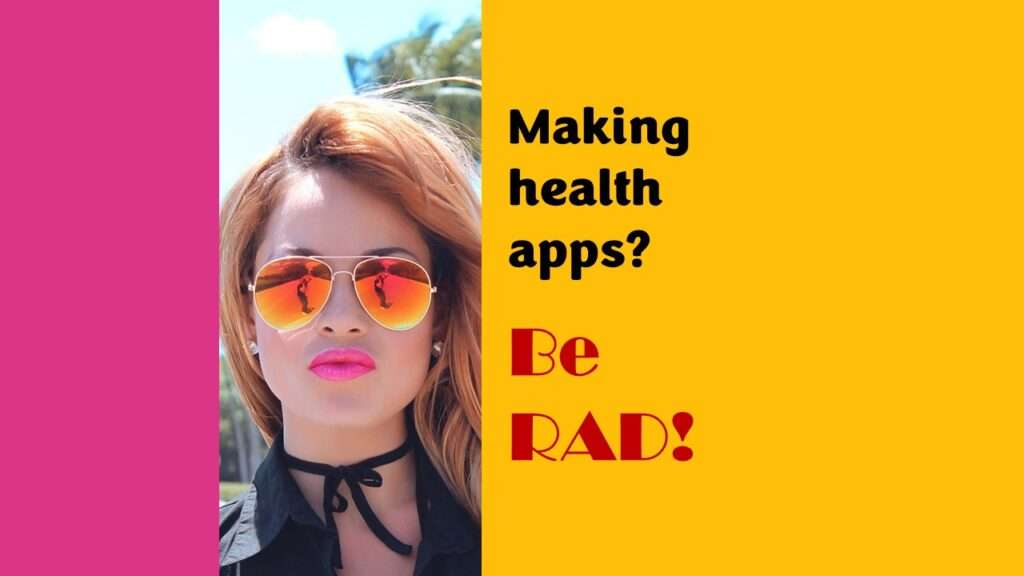
“Rapid application development” (RAD) refers to an approach to designing and developing computer applications. In public health and healthcare, we are not taught about application development – but it’s good for us to learn about it, since we have to deal with data from health applications. My blog post talks about the RAD approach I […]

WISE Summit 2023: Women Leaders “Created by Courage”

For the WISE 2023 Summit at Northeastern University in Boston, Monika hosted a business intelligence workshop.

WISE Summit 2023 at Northeastern University was the biggest and best one so far! I was honored to lead a business intelligence workshop, as I talk about in my blog post.

Time Series Plots in R Using ggplot2 Are Ultimately Customizable

Time series plots can be customized if you use package ggplot2 in R. You can place labels and configure axes.

Time series plots in R are totally customizable using the ggplot2 package, and can come out with a look that is clean and sharp. However, you usually end up fighting with formatting the x-axis and other options, and I explain in my blog post.

Understand US Payroll Data from this Online Course about Payroll

Check with payroll royalty data processing

If you receive payroll in the US, you can see that the data on the payroll stub is pretty complicated. This course in payroll is helpful for data scientists who find themselves analyzing US payroll data, because it explains the business rules and regulations behind the data.

Verified by MonsterInsights