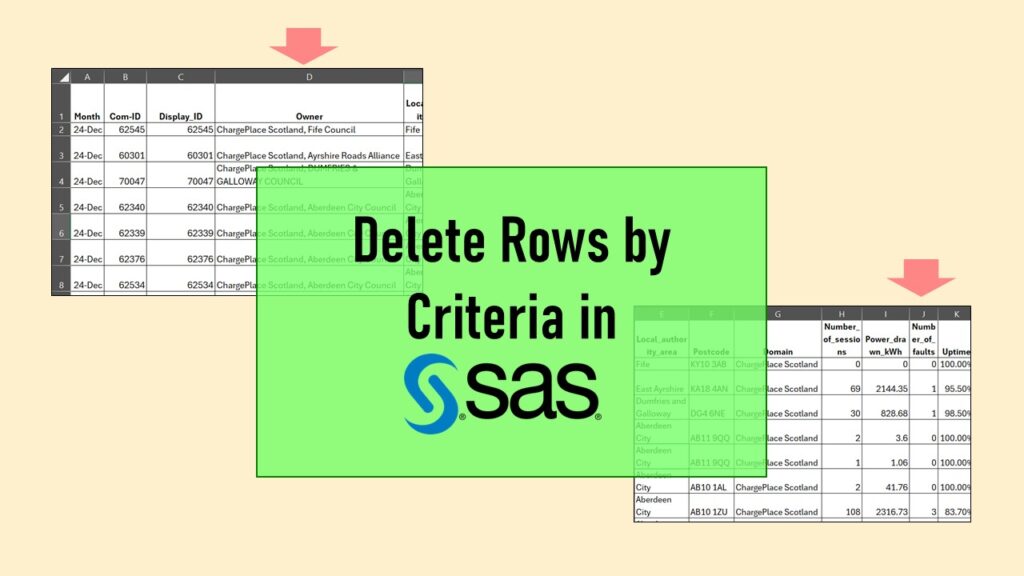
Tag Archives: business data

NHANES Data: Pitfalls, Pranks, Possibilities, and Practical Advice

If you are interested in population-level surveillance data, you might have thought about using NHANES data in portfolio projects.

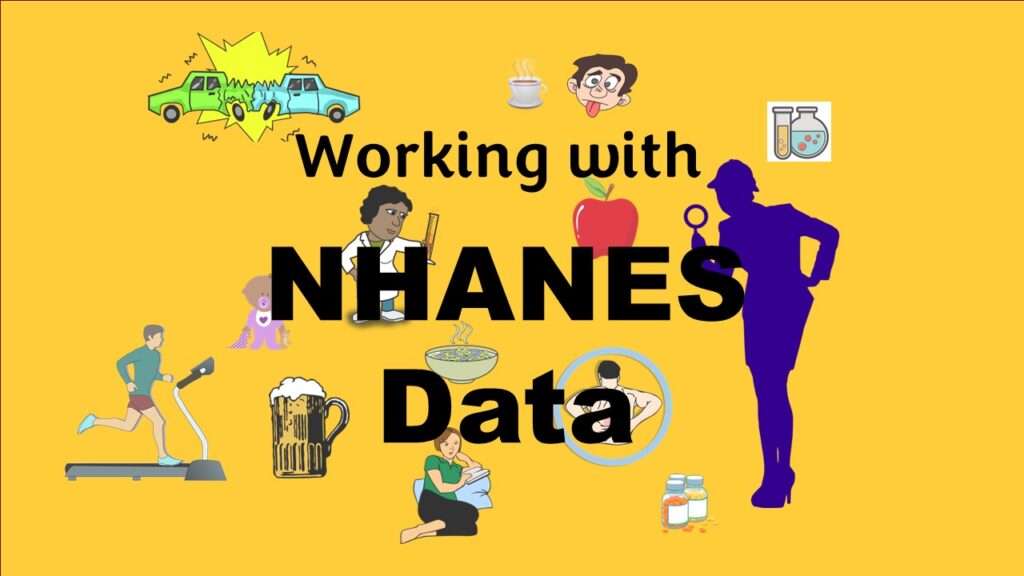
NHANES data piqued your interest? It’s not all sunshine and roses. Read my blog post to see the pitfalls of NHANES data, and get practical advice about using them in a project.

Defaults in PowerPoint: Setting Them Up for Data Visualizations

The defaults in PowerPoint are really set up for making presentations, not data visualizations.

Defaults in PowerPoint are set up for slides – not data visualizations. Read my blog post for tips on reconfiguring PowerPoint to make it easy for dataviz!

WISE Summit 2023: Women Leaders “Created by Courage”

For the WISE 2023 Summit at Northeastern University in Boston, Monika hosted a business intelligence workshop.

WISE Summit 2023 at Northeastern University was the biggest and best one so far! I was honored to lead a business intelligence workshop, as I talk about in my blog post.

AI on the Edge: What it is, and Data Storage Challenges it Poses

AI on the edge refers to doing the AI processing and equations at the site of the object collecting the data.

“AI on the edge” was a new term for me that I learned from Marc Staimer, founder of Dragon Slayer Consulting, who was interviewed in a podcast. Marc explained how AI on the edge poses a data storage problem, and my blog post proposes a solution!

Testimonials for Monika Wahi’s Linked In Data Science Courses

If you have questions about your journey toward a data science career, sometimes you can get them answered with online resources, but sometimes you do not get the information.

Testimonials for Monika Wahi’s data science courses on LinkedIn Learning are posted here. Read what learners are saying to help you decide if you want to take the courses!

Making Upset Plots with R Package UpSetR Helps Visualize Patterns of Attributes

If you are having trouble setting options using R making plots, then you should read this blog post.

Making upset plots with R package UpSetR is an easy way to visualize patterns of attributes in your data. My blog post demonstrates making patterns of co-morbidities in health survey respondents from the BRFSS, and walks you through setting text and color options in the code.

Convert CSV to RDS When Using R for Easier Data Handling

If you want to use R for a project and the source CSV is very big, it can improve input/output efficiency to convert the file to an RDS.

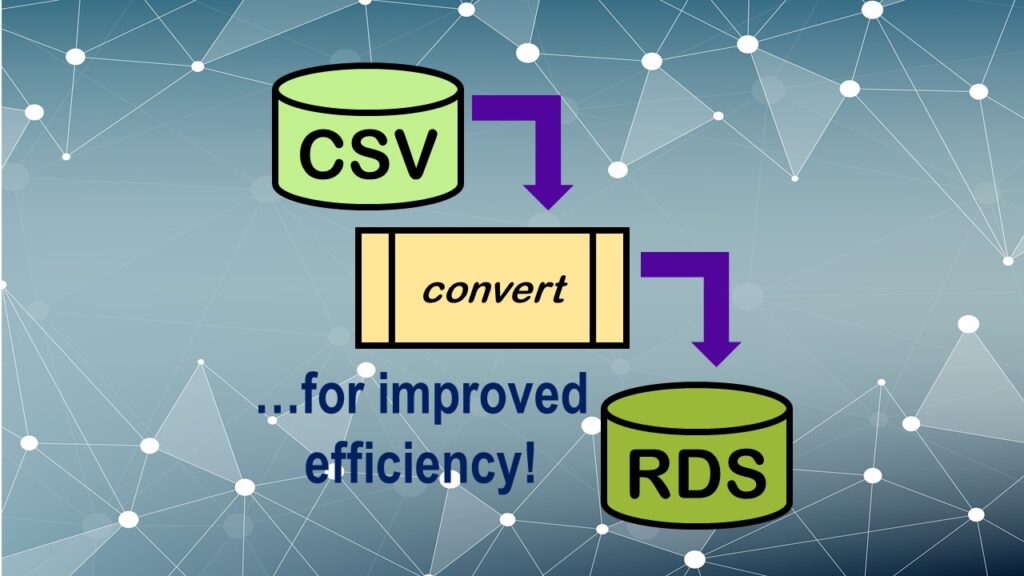
Convert CSV to RDS is what you want to do if you are working with big data files in R GUI and want to improve efficiency. Read my blog post for an explanation and video demonstrations of this process!

Interview Preparation for Data Science Positions: Tips and Tricks

You can actually prepare for interviewing for data science positions by doing certain activities, like looking up common questions, and practicing answers.

Interview preparation for data science jobs can involve taking several simple, actionable steps to make yourself feel confident and ready to answer questions with ease. Read my blog post for my tips and tricks!

Counting Rows in SAS and R Use Totally Different Strategies

If you are a data scientist working with large datasets, you need to learn the commands to count both columns and rows in the dataset, whether you are using SAS or R.

Counting rows in SAS and R is approached differently, because the two programs process data in different ways. Read my blog post where I describe both ways.

Data Science YouTube Channel Planned Expansion for 2022 – Please Subscribe!

In 2022 I am going to be putting new content on my YouTube channel focused on teaching data science, and providing educational resources.

Data science YouTube channel that brings you educational resources, career advice, live interactive sessions, and keeps you up-to-date in innovation and analytics – that’s what I have planned for 2022! Read my blog post for details.

Verified by MonsterInsights