
“AI on the edge” was a new term for me that I learned from Marc Staimer, founder of Dragon Slayer Consulting, who was interviewed in a podcast. Marc explained how AI on the edge poses a data storage problem, and my blog post proposes a solution!
Tag Archives: SAS programming
31
Mar
Mar
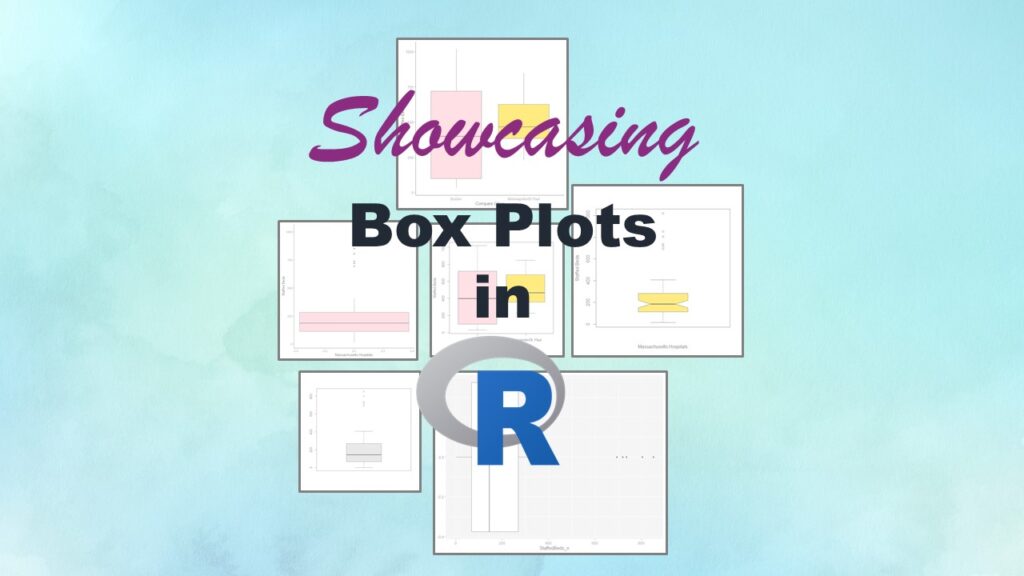
Making box plots in R affords you many different approaches and features. My blog post will show you easy ways to use both base R and ggplot2 to make box plots as you are proceeding with your data science projects.
16
Feb
Feb
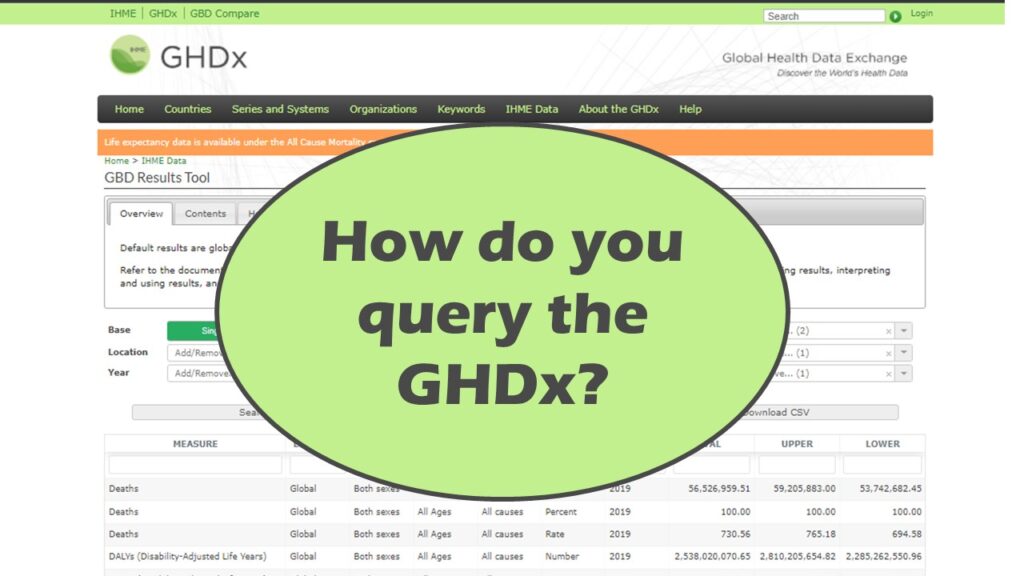
Querying the GHDx database is challenging because of its difficult user interface, but mastering it will allow you to access country-level health data for comparisons! See my demonstration!
04
Feb
Feb
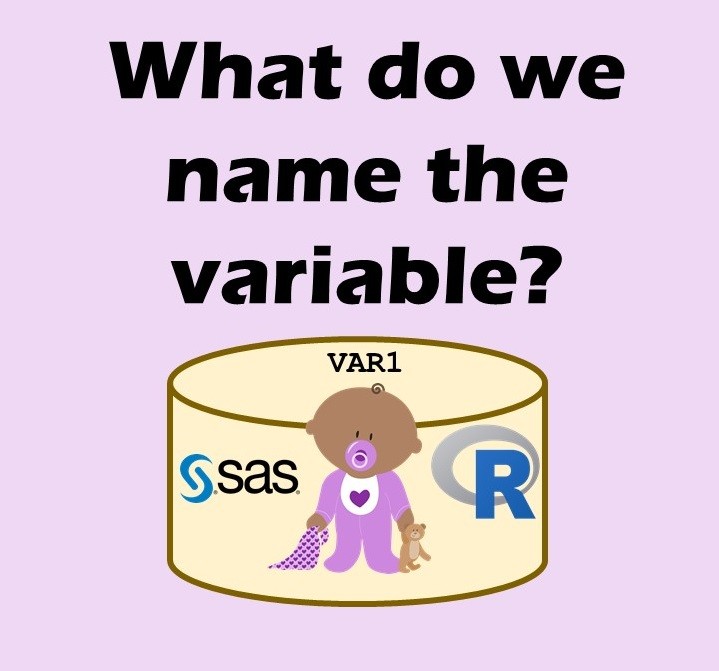
Variable names in SAS and R are subject to different “rules and regulations”, and these can be leveraged to your advantage, as I describe in this blog post.
Data Science
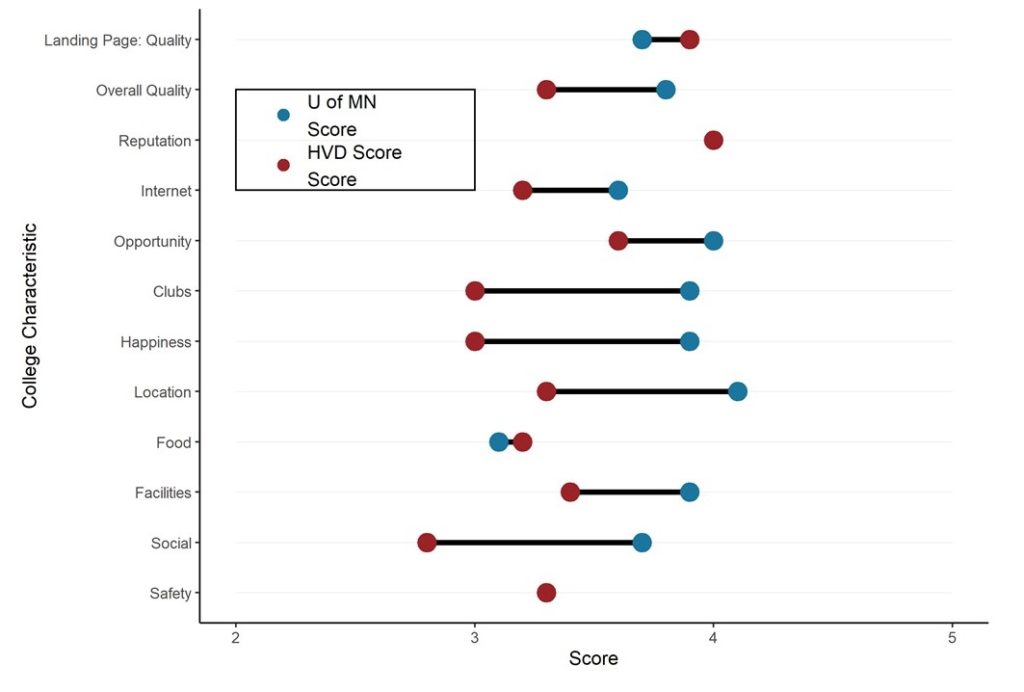
Dumbbell Plot for Comparison of Rated Items: Which is Rated More Highly – Harvard or the U of MN?
20
Sep
Sep
Want to compare multiple rankings on two competing items – like hotels, restaurants, or colleges? I show you an example of using a dumbbell plot for comparison in R with the ggalt package for this exact use-case!
Quality Assurance/Quality Improvement (QA/QI)
“Bad Blood” Highlights the Issues with No Administrative Barrier between Research and Clinical Data: Part 5 of 5

12
Jul
Jul
Read my last post in a series on data-related misconduct at startup Theranos outlined in the book, “Bad Blood”, where I discuss their lack of administrative barrier between research and clinical data.
26
Nov
Nov
Get to know three of my favorite SAS documentation pages: the one with sort order, the one that lists all the SAS formats, and the one that explains all the SAS operators and expressions!
20
Oct
Oct
SAS is known for big data and data warehousing, but how do you actually design and build a SAS data warehouse or data lake? What datasets do you include? How do you transform them? How do you serve warehouse users? How do you manage your developers? This book has your answers!