Tag Archives: administrative manual

Bivariate Table: How to Make a Descriptive Statistical Summary in Excel

Do you know how to do descriptive statistics? Learn how to make better visualizations.

Bivariate table is full descriptive summaries of the variables in the analytic dataset being used in a research analysis. To learn how to make one, take my online course, “How to Make a Bivariate Table in Excel”.

AI Careers: Riding the Bubble

If you are a data scientist, you may want to do statistics, but you may also be interested in machine learning and artificial intelligence.

AI careers are not easy to navigate. Read my blog post for foolproof advice for those interested in building a career in AI.

Excel for Managing Research: Learn How to Use Microsoft Excel as a Research Management Tool

I have used Excel for managing research since the early 1990s, when I was mentored by a grants administrator who took me under her wing. She showed me how to use abstract deadline grids, grant submission grids, and action item grids to manage research activities. Now, I’ve made these skills available to you through my online course, “MS Excel for Managing Research”!

Excel for Managing Research is a short, practical course that will give you the skills you need to run research teams and activities using this simple, flexible tool!

Data Close-out Course: Learn How to do Data Close-out Online!

Data close-out course available in the DPS learning center is long and comprehensive, so I call it a “boot camp”. This data-close out course will teach you what you need to know to plan a data close-out.

Data close-out course is what you need if you want to combine data from multiple sources and serve it to users. Learn how with our online boot camp!

Connecting SAS to Other Applications: Different Strategies

Did you know it is possible to integrate SAS with other data environments, like Microsoft SQL or Excel?

Connecting SAS to other applications is often necessary, and there are many ways to do it. Read this blog post for a couple of use-cases of SAS data integration using various SAS components.

Management Tips for Data Scientists

When working in data science, there are some tips and tricks to managing your communication and relationship with superiors that can help you advance in your career.

Management tips for data scientists can be used by anyone – at work and in your personal life! Get the details in my blog post.

REDCap Mess: How it Got There, and How to Clean it Up

REDCap mess on your hands? The REDCap designers made the application so loosey goosey, you can really program yourself into a messy corner if you don't plan well.

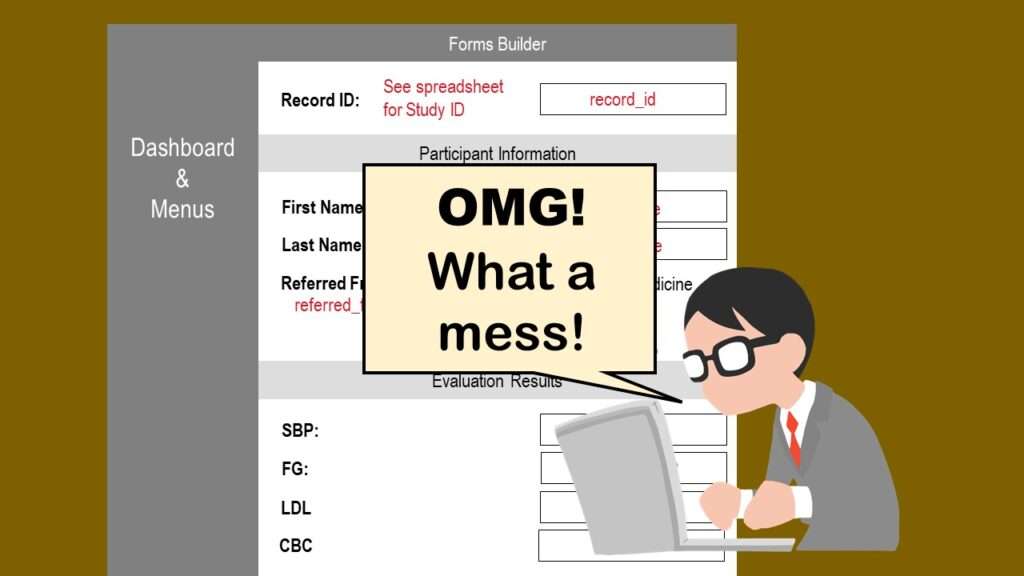
REDCap mess happens often in research shops, and it’s an analysis showstopper! Read my blog post to learn my secret tricks for breaking through the barriers and getting on with data analytics!

The Paste Command in R is Great for Labels on Plots and Reports

The paste command is used to concatenate strings in R. You can use it different ways, which is what I demonstrate in my blog and videos.

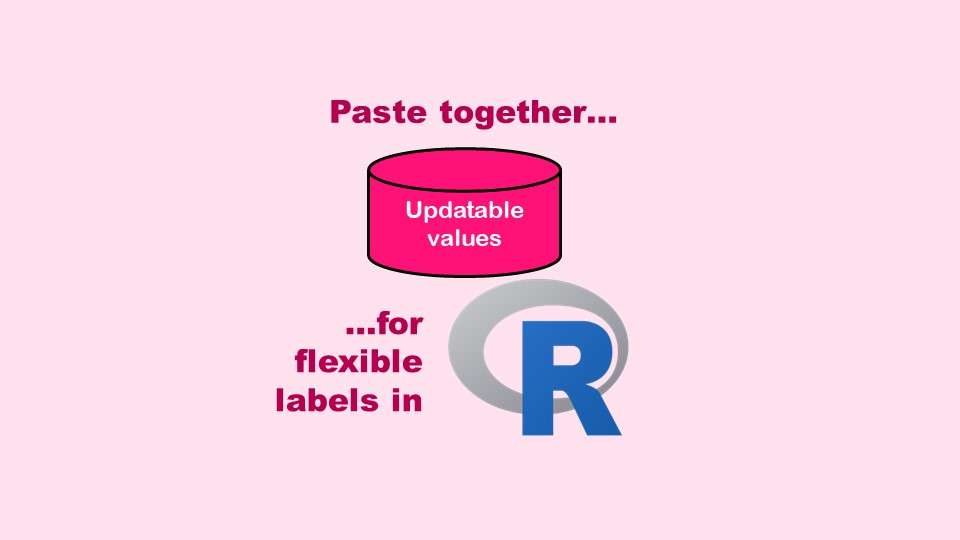
The paste command in R is used to concatenate strings. You can leverage the paste command to make refreshable label objects for reports and plots, as I describe in my blog post.

Four Levels of Intervention for Public Health: How to Apply This Framework

Four levels of public health interventions should be addressed when dealing with public health problems.

Four levels of intervention is a framework we use in public health to think about how to attack a problem. I explain it and give a few examples of application in my blog post (along with a video).

Interview Preparation for Data Science Positions: Tips and Tricks

You can actually prepare for interviewing for data science positions by doing certain activities, like looking up common questions, and practicing answers.

Interview preparation for data science jobs can involve taking several simple, actionable steps to make yourself feel confident and ready to answer questions with ease. Read my blog post for my tips and tricks!

Verified by MonsterInsights