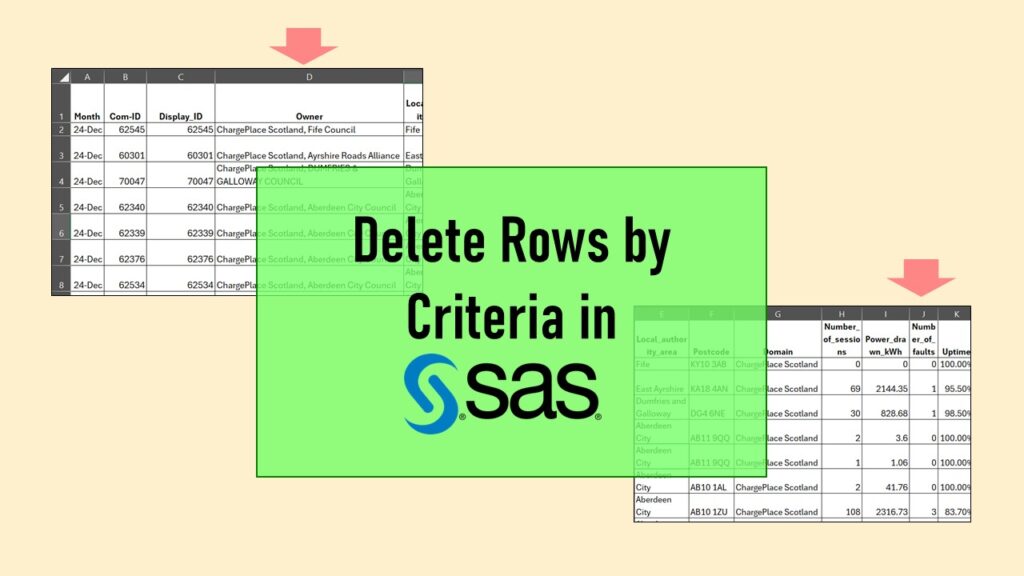
Delete if rows meet a certain criteria is a common approach to paring down a dataset. Read my blog for an example in SAS!
Tag Archives: data flow diagrams

11
Oct
Oct
Recoloring plots in R? Want to learn how to use an image to inspire R color palettes you can use in ggplot2 plots? Read my blog post to learn how.

08
Apr
Apr
Data curation solution that I posted recently with my blog post showing how to do upset plots in R using the UpSetR package was itself kind of a masterpiece. Therefore, I thought I’d dedicate this blog post to explaining how and why I did it.
28
Jan
Jan
Referring to variables in processing is different conceptually when thinking about SAS compared to R. I explain the differences in my blog post.

06
Jan
Jan
Paid mentoring for data science can be worth the cost in certain circumstances – but not others. My blog post provides guidance on hiring a paid mentor.
19
Oct
Oct
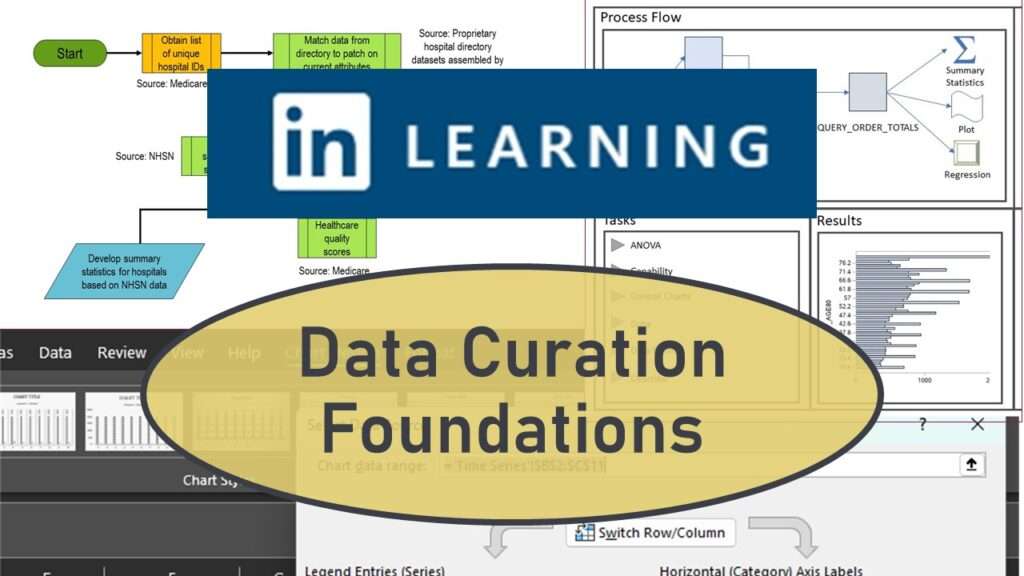
Curation files are especially helpful for communicating about data on teams. Learn more about what you’ll learn when you take my online LinkedIn Learning data curation course!