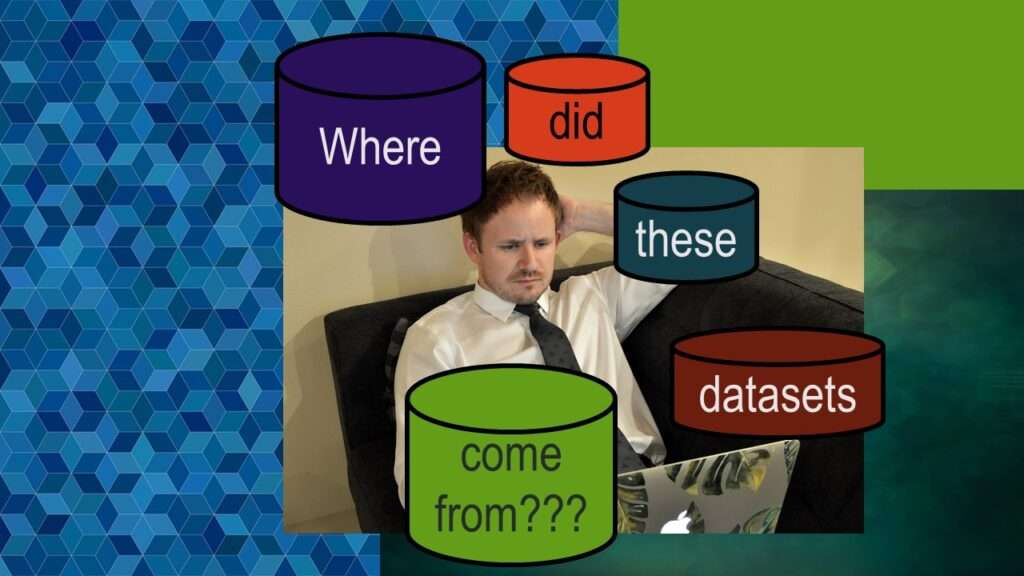
Dataset source documentation is good to keep when you are doing an analysis with data from multiple datasets. Read my blog to learn how easy it is to throw together some quick dataset source documentation in PowerPoint so that you don’t forget what you did.
Tag Archives: survey data
28
Jan
Jan
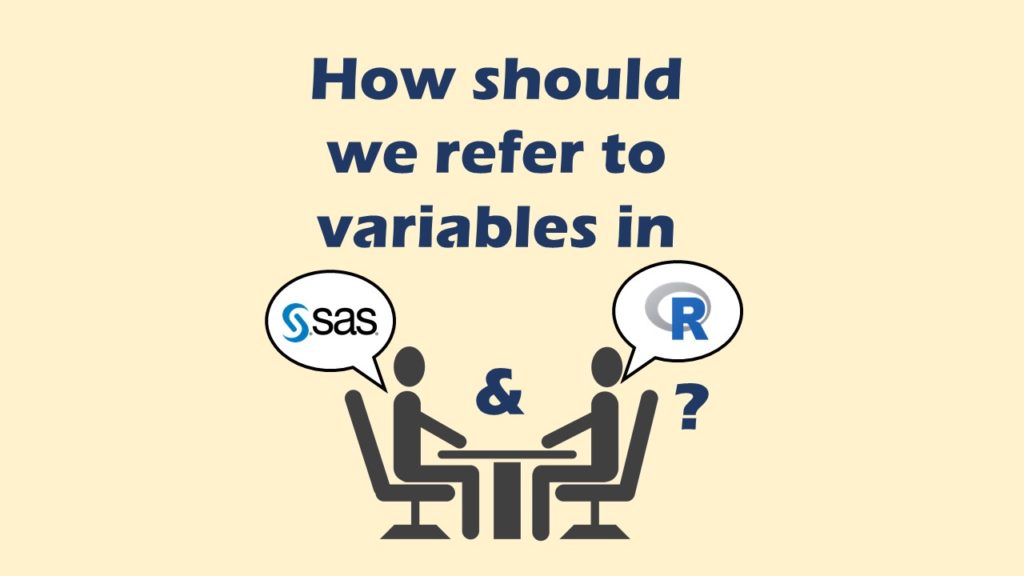
Referring to variables in processing is different conceptually when thinking about SAS compared to R. I explain the differences in my blog post.
26
Dec
Dec
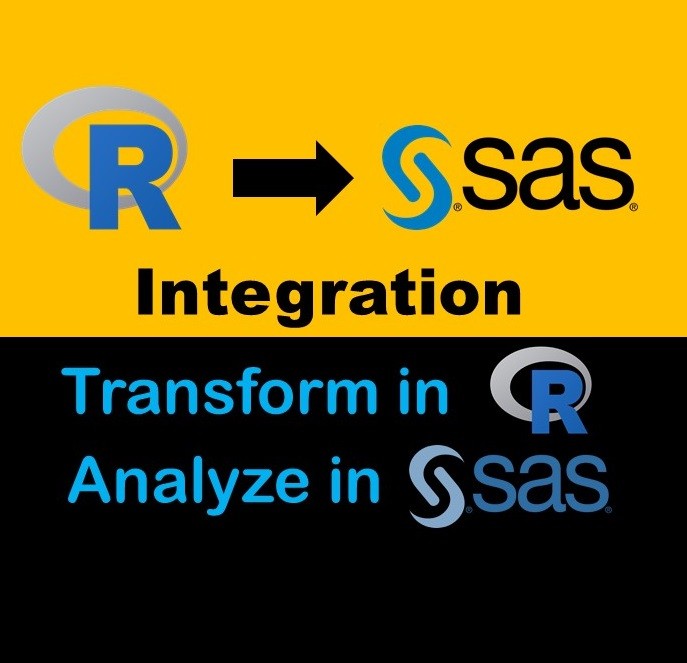
Looking for a SAS-R integration example that uses the best of both worlds? I show you a use-case where I was in a hurry, and did transformation in R with the analysis in SAS!
30
Jul
Jul
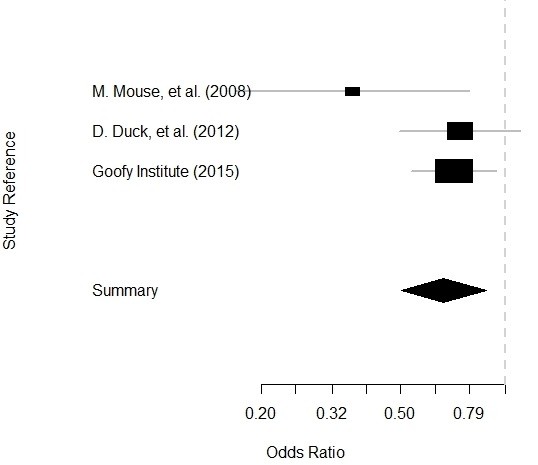
Getting data for meta-analysis together can be challenging, so I walk you through the simple steps I take, starting with the scientific literature, and ending with a gorgeous and evidence-based Forrest plot!
14
Oct
Oct
I use the datasets from the Behavioral Risk Factor Surveillance Survey (BRFSS) to demonstrate in a lot of my data science tutorials. The BRFSS are free and available to the public – but they are kind of buried on the web site. This blog post serves as a “map” to help you find them!
11
Oct
Oct
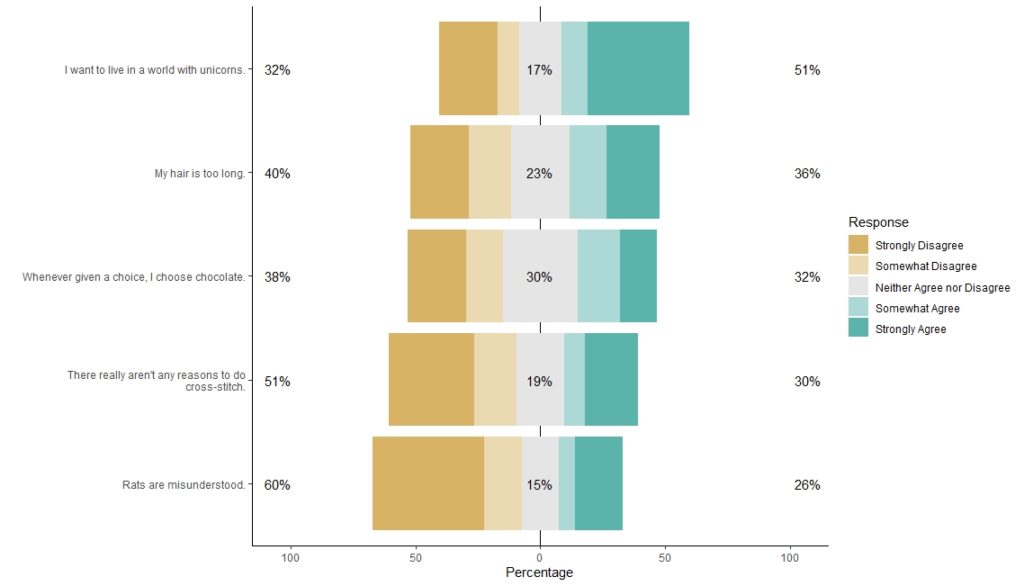
I love the Likert package in R, and use it often to visualize data. The problem is that sometimes, I have sparse data, and this can cause problems with the package. This blog post shows you a workaround, and also, a way to format the final plot that I think looks really great!