Color in visualizations of data curation and other data science documentation can be used to enhance communication – I show you how!
Tag Archives: Council on Education in Public Health
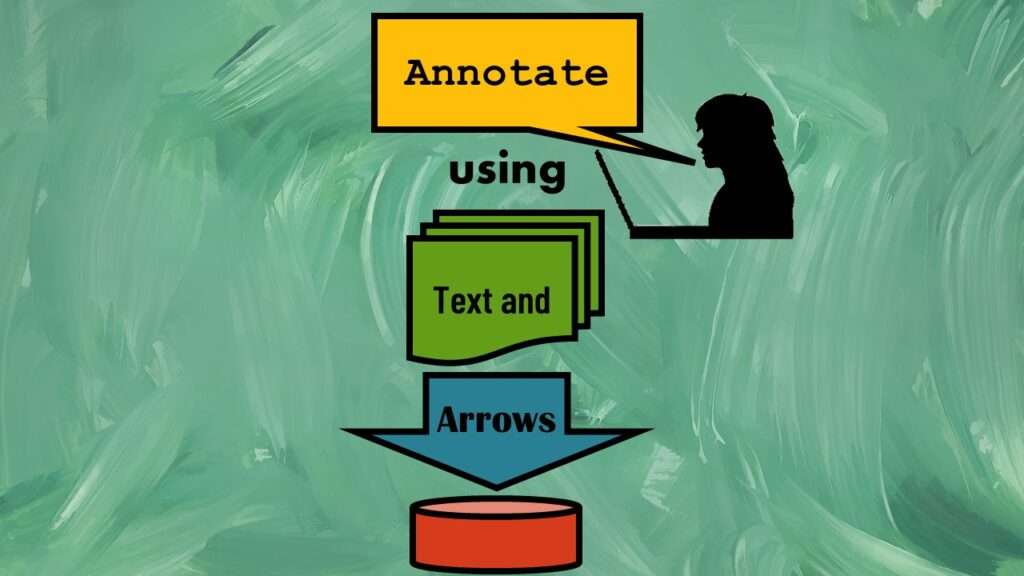
Text and arrows in dataviz, if used wisely, can help your audience understand something very abstract, like a data pipeline. Read my blog post for tips in choosing images for your data visualizations!
Table editing in R is easier than in SAS, because you can refer to columns, rows, and individual cells in the same way you do in MS Excel. Read my blog post for example R table editing code.
R for logistic regression in health data analytics is a reasonable choice, if you know what packages to use. You don’t have to use SAS! My blog post provides you example R code and a tutorial!
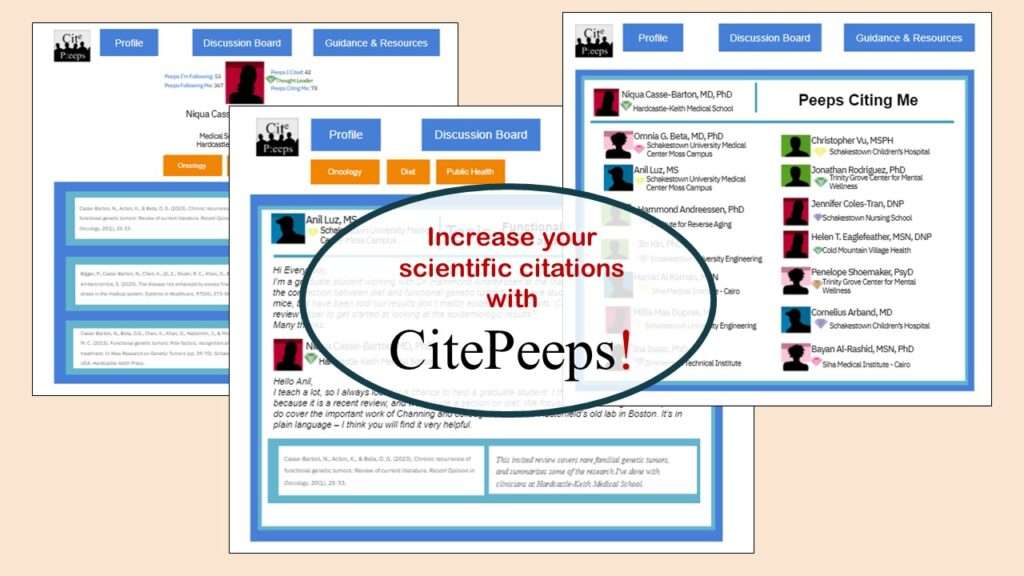
CitePeeps is a new online community of scientific authors focused on increasing the number of citations to their published works. Join us!
Benchmarking runtime is different in SAS compared to other programs, where you have to request the system time before and after the code you want to time and use variables to do subtraction, as I demonstrate in this blog post.
“What is the ONC?” is what I used to ask before I realized it involves health technology. Although ONC just means “Office of the National Coordinator”, this agency is now known as HealthIT.gov, as I explain in my blog post.
What does the SAMHSA actually do for mental health and substance abuse patients in the US? The answer is, “nothing directly” – however, indirectly, SAMHSA has had a profound impact on behavioral health patients, and the result has not always been positive, as you can read in my blog post.
Four levels of intervention is a framework we use in public health to think about how to attack a problem. I explain it and give a few examples of application in my blog post (along with a video).
“What is the HRSA?” can be answered two ways: with a short answer, and a long answer. The short answer is that it is the agency that funds public health departments in the United States. The long answer, which I unpack in my blog post, is more nuanced, harrowing, and ultimately, depressing.
- 1
- 2


