Dataset source documentation is good to keep when you are doing an analysis with data from multiple datasets. Read my blog to learn how easy it is to throw together some quick dataset source documentation in PowerPoint so that you don’t forget what you did.
Tag Archives: cross-sectional study
07
Mar
Mar
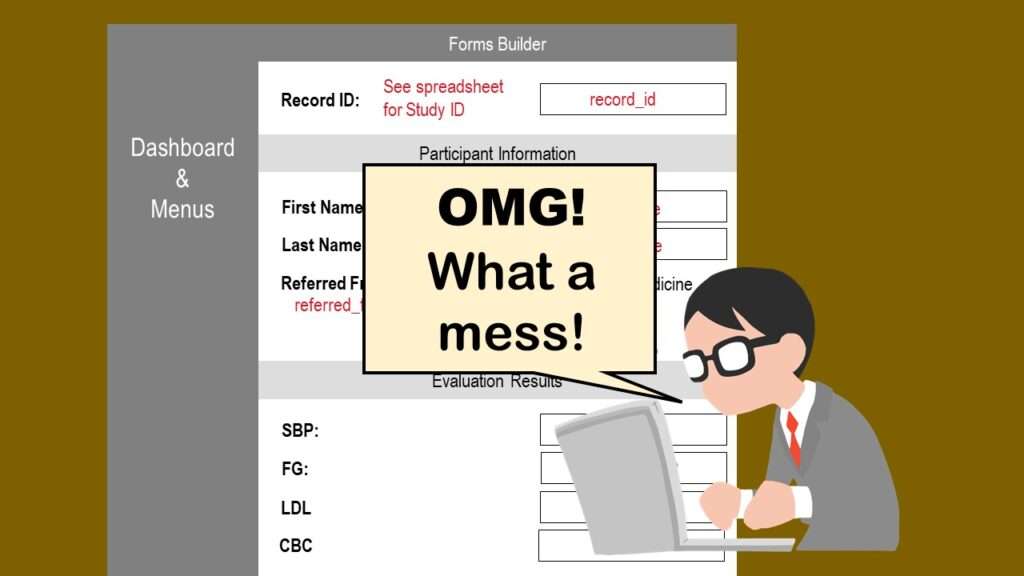
REDCap mess happens often in research shops, and it’s an analysis showstopper! Read my blog post to learn my secret tricks for breaking through the barriers and getting on with data analytics!
13
May
May
“What is the ONC?” is what I used to ask before I realized it involves health technology. Although ONC just means “Office of the National Coordinator”, this agency is now known as HealthIT.gov, as I explain in my blog post.

11
Apr
Apr
Time series plots in R are totally customizable using the ggplot2 package, and can come out with a look that is clean and sharp. However, you usually end up fighting with formatting the x-axis and other options, and I explain in my blog post.
14
Jan
Jan
Counting rows in SAS and R is approached differently, because the two programs process data in different ways. Read my blog post where I describe both ways.
14
Oct
Oct
I use the datasets from the Behavioral Risk Factor Surveillance Survey (BRFSS) to demonstrate in a lot of my data science tutorials. The BRFSS are free and available to the public – but they are kind of buried on the web site. This blog post serves as a “map” to help you find them!