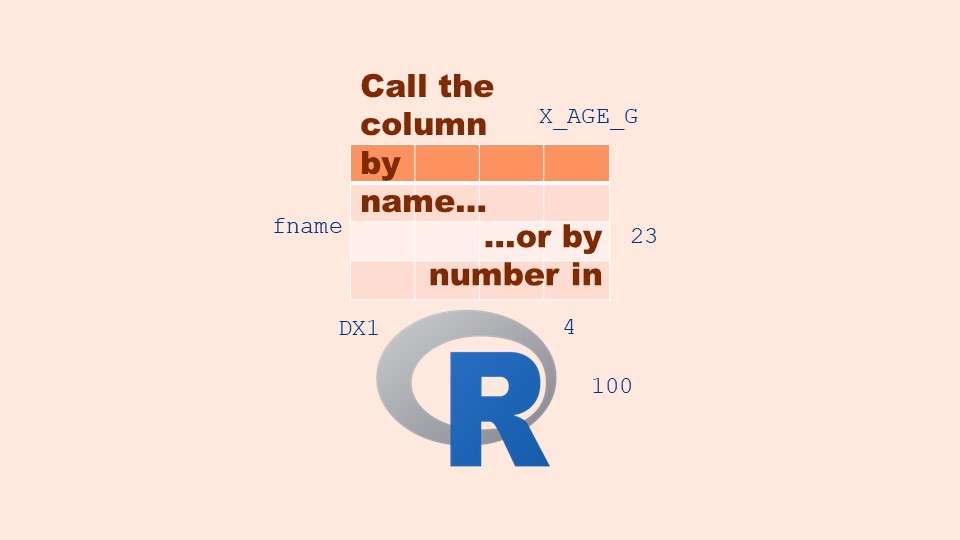
Referring to columns in R can be done using both number and field name syntax. Although field name syntax is easier to use in programming, my blog demonstrates how you can use column numbers to make automation easier.
Tag Archives: ggplot2 open source

11
Oct
Oct
Recoloring plots in R? Want to learn how to use an image to inspire R color palettes you can use in ggplot2 plots? Read my blog post to learn how.
20
Apr
Apr
Pie chart ggplot style is surprisingly hard to make, mainly because ggplot2 did not give us a circle shape to deal with. But I explain how to get around it in my blog pot.

11
Apr
Apr
Time series plots in R are totally customizable using the ggplot2 package, and can come out with a look that is clean and sharp. However, you usually end up fighting with formatting the x-axis and other options, and I explain in my blog post.
31
Mar
Mar
Making box plots in R affords you many different approaches and features. My blog post will show you easy ways to use both base R and ggplot2 to make box plots as you are proceeding with your data science projects.
25
Mar
Mar
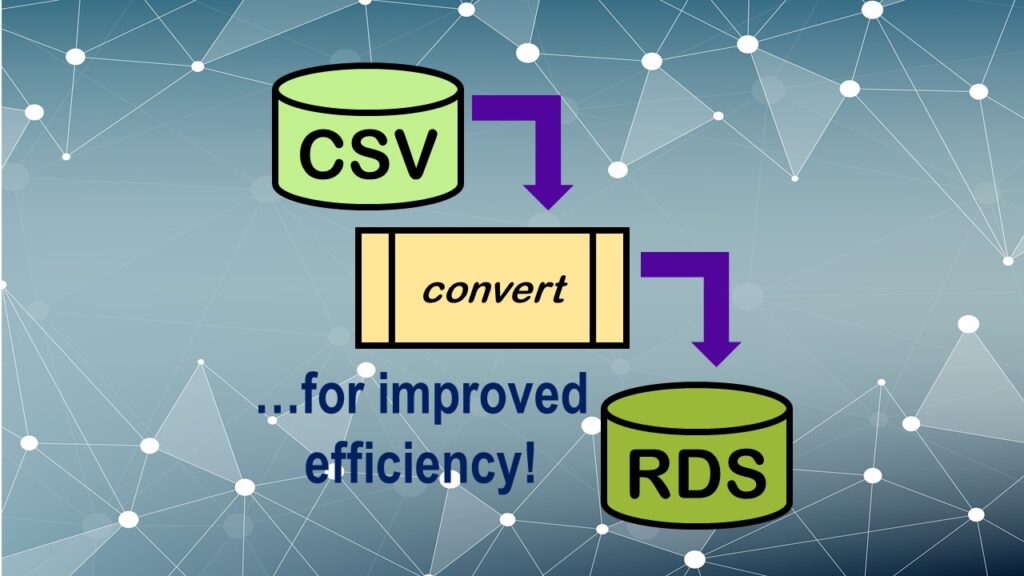
Convert CSV to RDS is what you want to do if you are working with big data files in R GUI and want to improve efficiency. Read my blog post for an explanation and video demonstrations of this process!
04
Feb
Feb
Variable names in SAS and R are subject to different “rules and regulations”, and these can be leveraged to your advantage, as I describe in this blog post.
07
Jan
Jan
Native formats in SAS and R of data objects have different qualities – and there are reasons behind these differences. Learn about them in this blog post!
Data Science
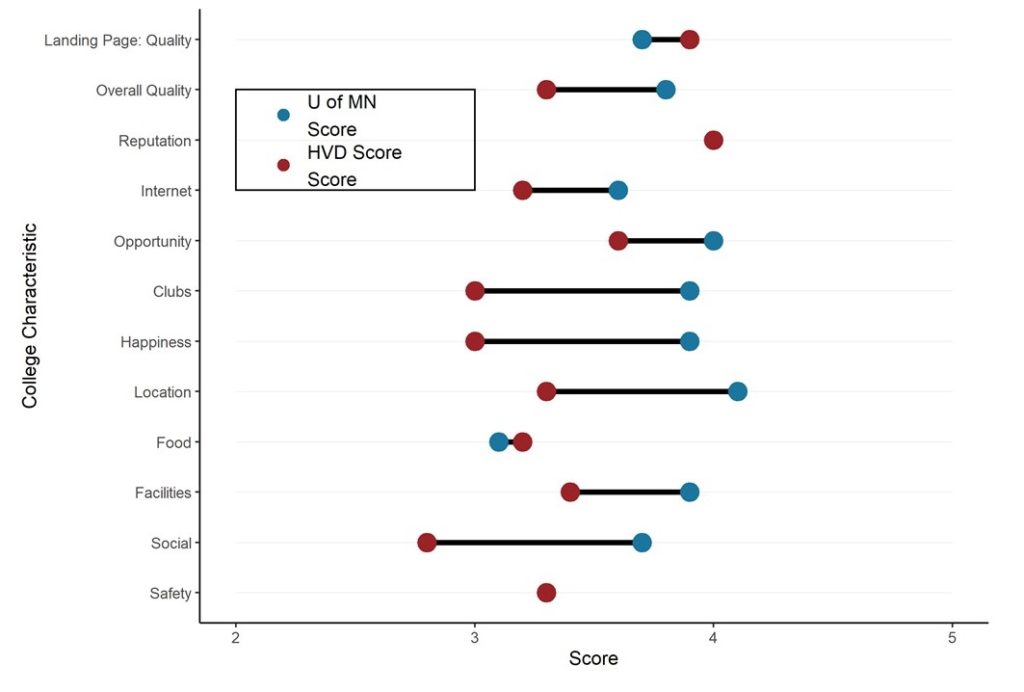
Dumbbell Plot for Comparison of Rated Items: Which is Rated More Highly – Harvard or the U of MN?
20
Sep
Sep
Want to compare multiple rankings on two competing items – like hotels, restaurants, or colleges? I show you an example of using a dumbbell plot for comparison in R with the ggalt package for this exact use-case!
19
Oct
Oct
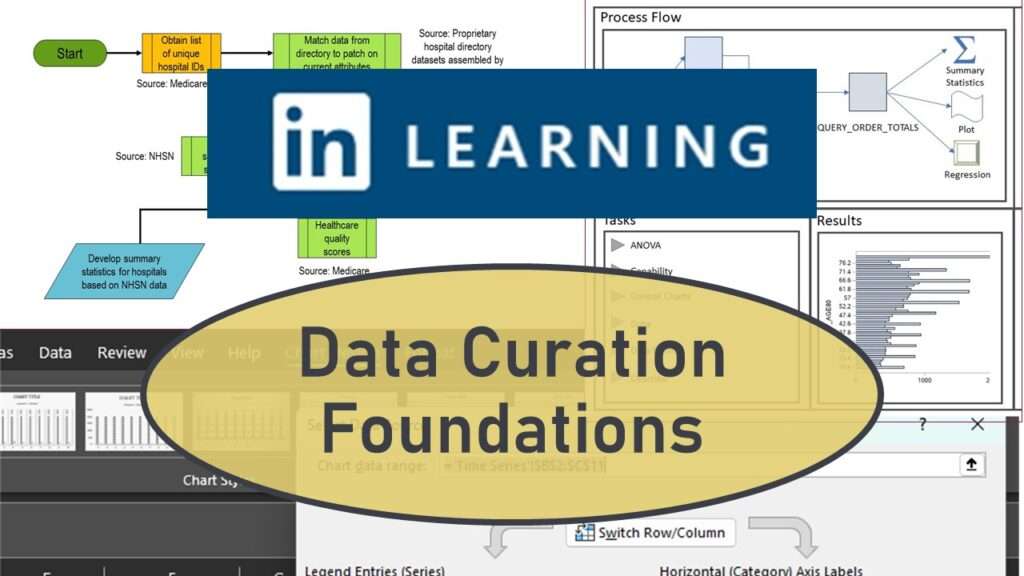
Curation files are especially helpful for communicating about data on teams. Learn more about what you’ll learn when you take my online LinkedIn Learning data curation course!