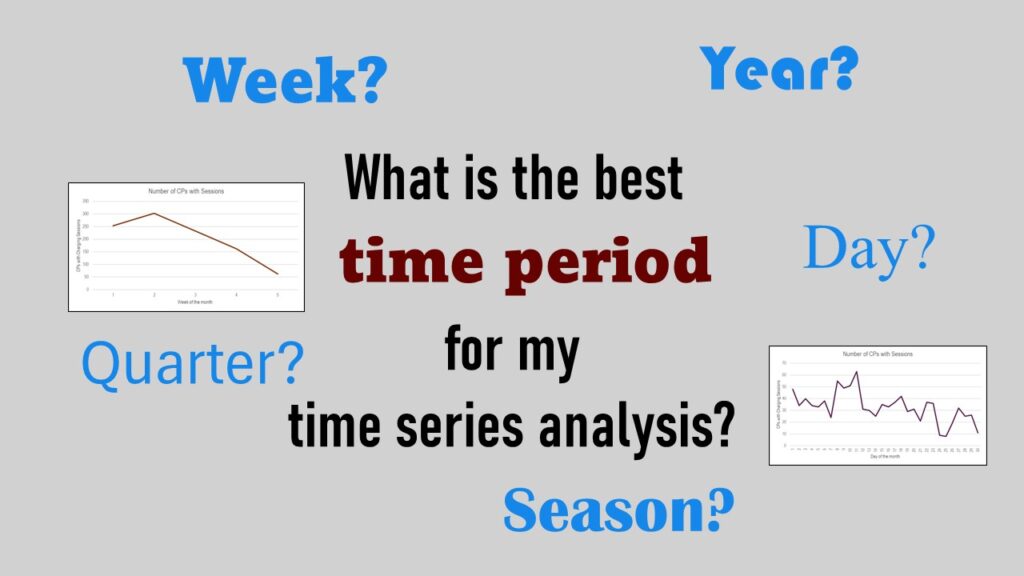
Time periods are important when creating a time series visualization that actually speaks to you! Get advice on my blog.
Tag Archives: time series plot

19
Jun
Jun
Understanding legacy data is necessary if you want to analyze datasets that are extracted from old systems. This knowledge is still relevant, as we still use these old systems today, as I discuss in my blog post.

11
Oct
Oct
Recoloring plots in R? Want to learn how to use an image to inspire R color palettes you can use in ggplot2 plots? Read my blog post to learn how.

11
Apr
Apr
Time series plots in R are totally customizable using the ggplot2 package, and can come out with a look that is clean and sharp. However, you usually end up fighting with formatting the x-axis and other options, and I explain in my blog post.