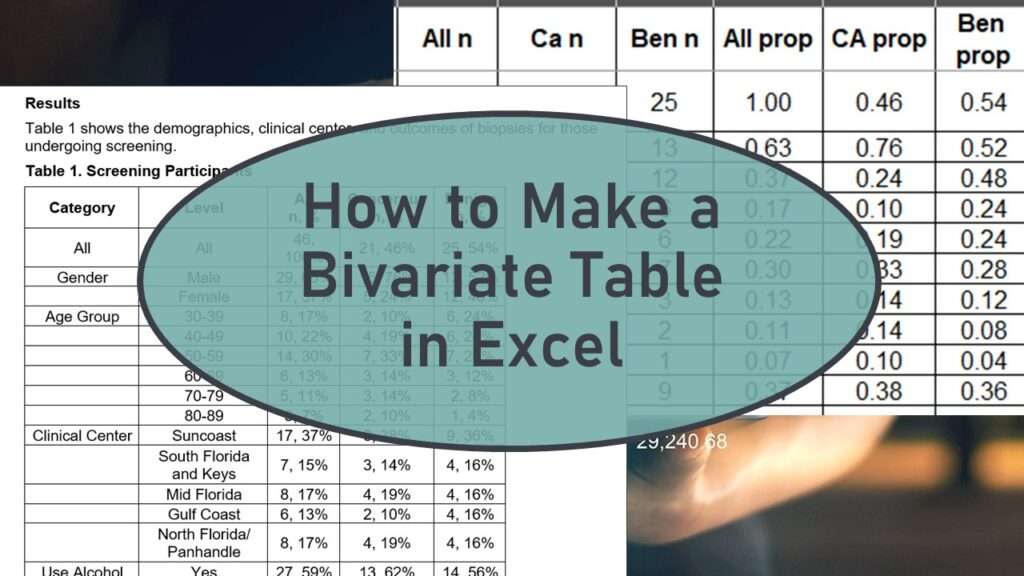
Bivariate table is full descriptive summaries of the variables in the analytic dataset being used in a research analysis. To learn how to make one, take my online course, “How to Make a Bivariate Table in Excel”.
Tag Archives: blog
Data science coaching for the right person at the right time can empower them to quickly turn around their grades in college, immediately wrap up a portfolio project, or springboard their career into management or higher! Read my blog to see how.
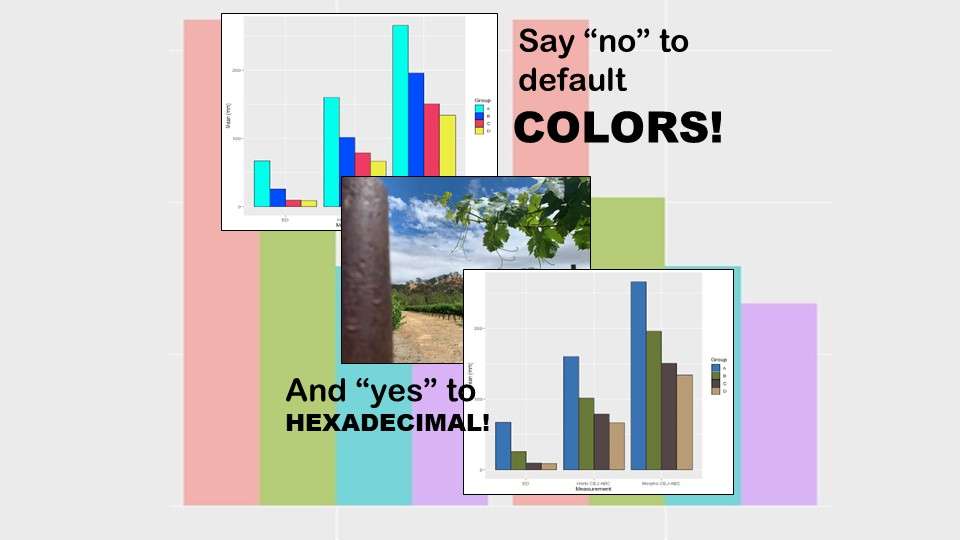
Recoloring plots in R? Want to learn how to use an image to inspire R color palettes you can use in ggplot2 plots? Read my blog post to learn how.


