Bivariate table is full descriptive summaries of the variables in the analytic dataset being used in a research analysis. To learn how to make one, take my online course, “How to Make a Bivariate Table in Excel”.
Category Archives: Courses
These are for blog posts predominantly about a particular course.
Excel for Managing Research is a short, practical course that will give you the skills you need to run research teams and activities using this simple, flexible tool!
Data close-out course is what you need if you want to combine data from multiple sources and serve it to users. Learn how with our online boot camp!
Data reduction diagram is used for evaluating selection bias. If you want to be seen as a data scientist who is transparent and uses rigorous methods, learn how to make a data reduction diagram from reading our blog post or taking our online course!
PowerPoint for visualizations is an easy choice – but you have to do a lot of hacks and configurations to get the software to do what you want. Take my online course and learn my tricks!
Applications basics are now essential knowledge if you want to do data science in healthcare. Get a crash course in applications basics!
Testimonials for Monika Wahi’s data science courses on LinkedIn Learning are posted here. Read what learners are saying to help you decide if you want to take the courses!
Want to get started with SAS, but don’t want the headache? I make it easy for you! Take my FREE course in getting started with SAS ODA!
Learn the “data science of data collection” through my free introductory course! If you want to learn more, continue with the whole six-course series. Great for graduate students and QA/QI professionals!
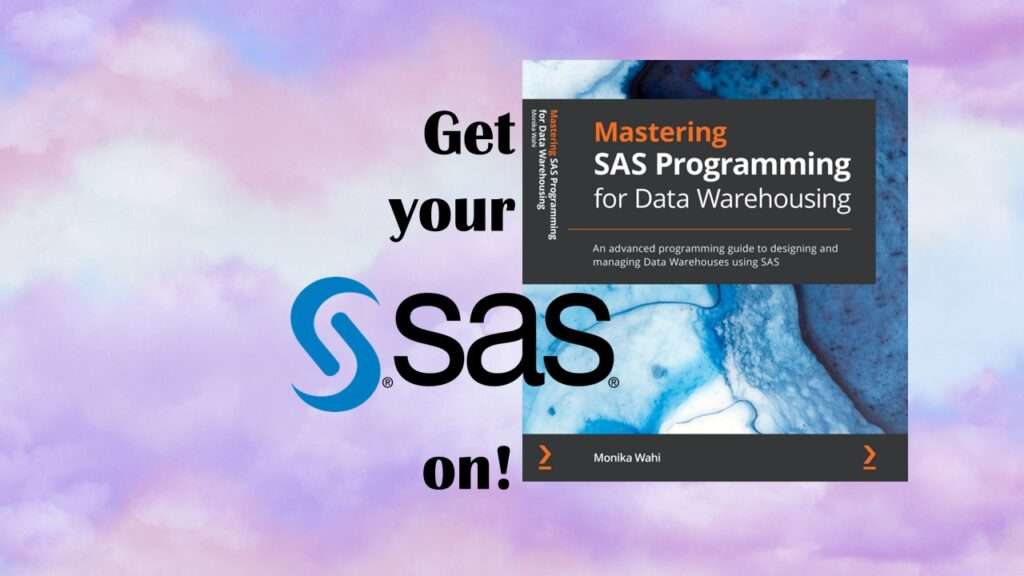
SAS is known for big data and data warehousing, but how do you actually design and build a SAS data warehouse or data lake? What datasets do you include? How do you transform them? How do you serve warehouse users? How do you manage your developers? This book has your answers!
- 1
- 2