Identify elements in research reports, and you’ll be able to understand them much more easily. My blog post shows you how!
Tag Archives: data preparation

13
Jul
Jul
Portfolio project examples are sometimes needed for newbies in data science who are looking to complete independent projects. This blog post provides some great examples of independent projects you can do with datasets available online!
22
Feb
Feb
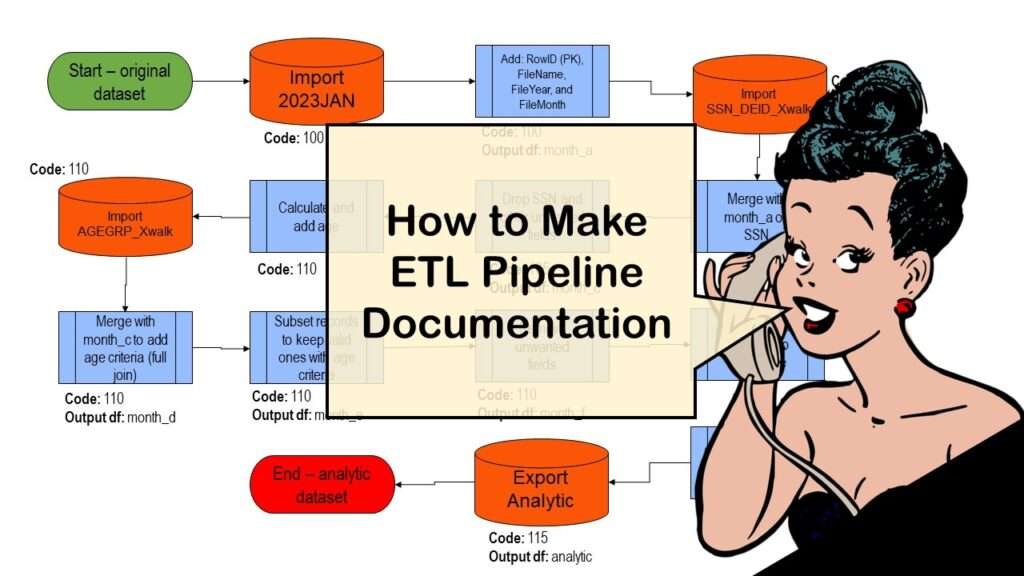
ETL pipeline documentation is great for team communication as well as data stewardship! Read my blog post to learn my tips and tricks.
20
Apr
Apr
Pie chart ggplot style is surprisingly hard to make, mainly because ggplot2 did not give us a circle shape to deal with. But I explain how to get around it in my blog pot.
08
Apr
Apr
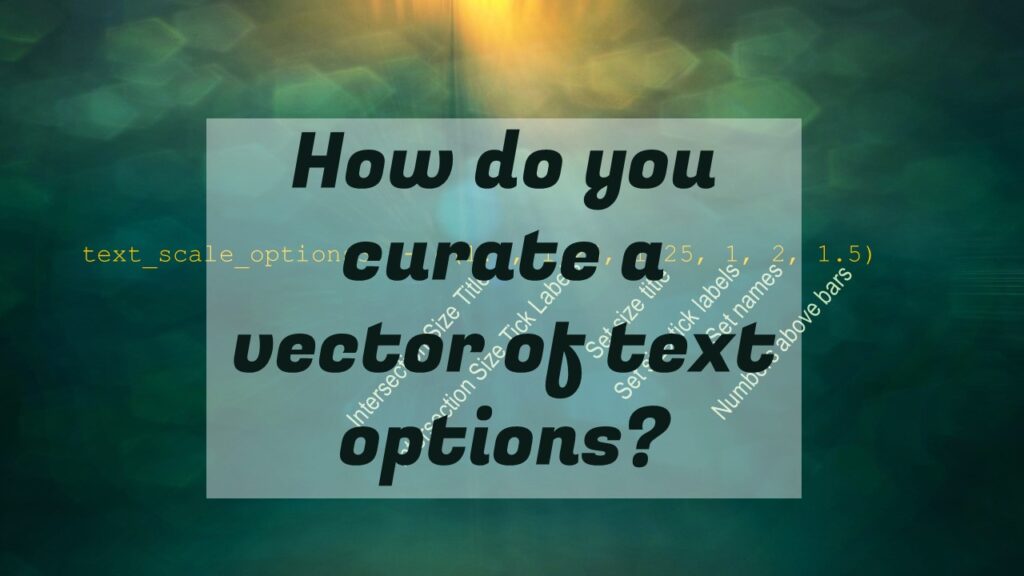
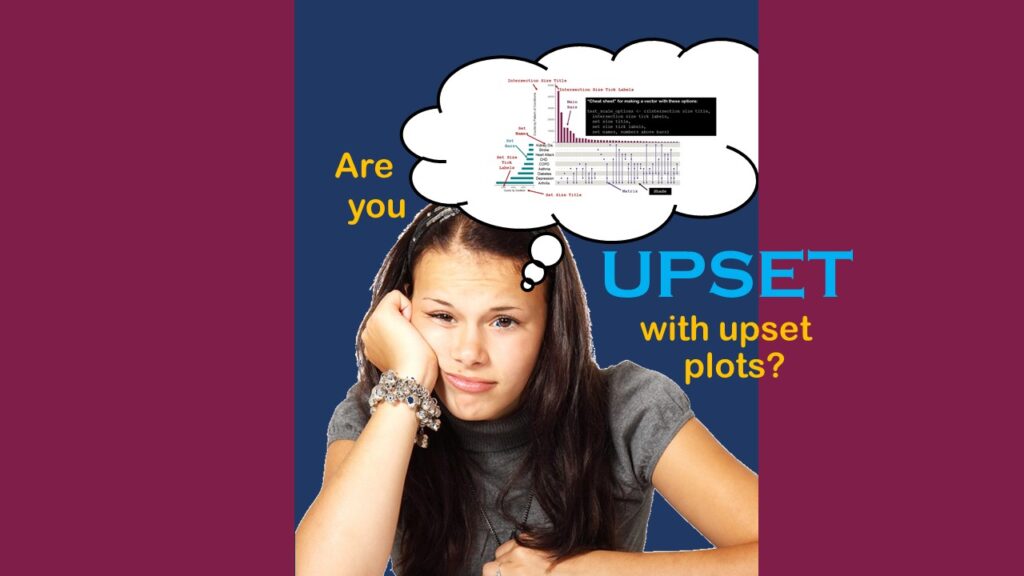
Data curation solution that I posted recently with my blog post showing how to do upset plots in R using the UpSetR package was itself kind of a masterpiece. Therefore, I thought I’d dedicate this blog post to explaining how and why I did it.
03
Apr
Apr
Making upset plots with R package UpSetR is an easy way to visualize patterns of attributes in your data. My blog post demonstrates making patterns of co-morbidities in health survey respondents from the BRFSS, and walks you through setting text and color options in the code.
31
Mar
Mar
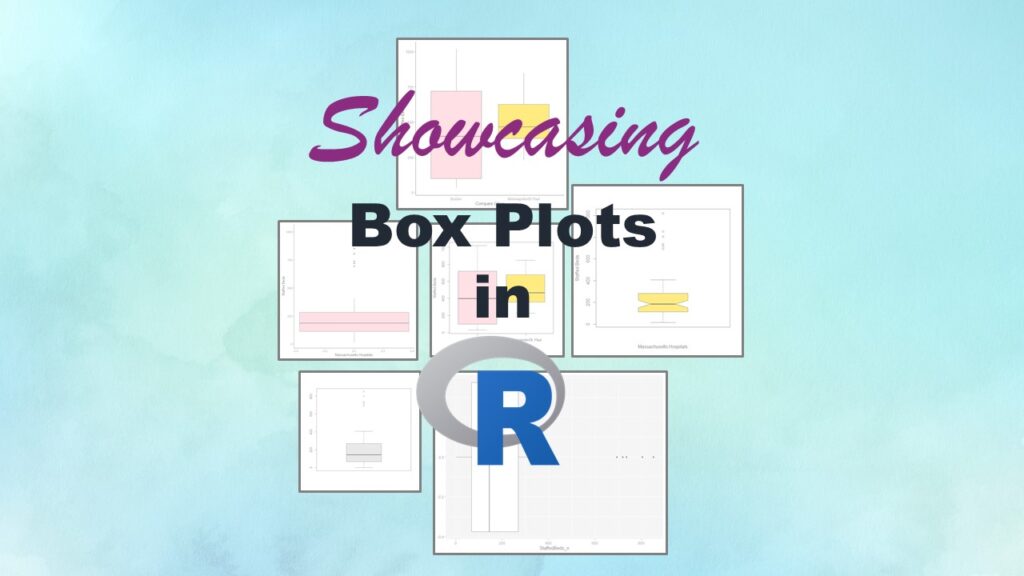
Making box plots in R affords you many different approaches and features. My blog post will show you easy ways to use both base R and ggplot2 to make box plots as you are proceeding with your data science projects.
25
Mar
Mar
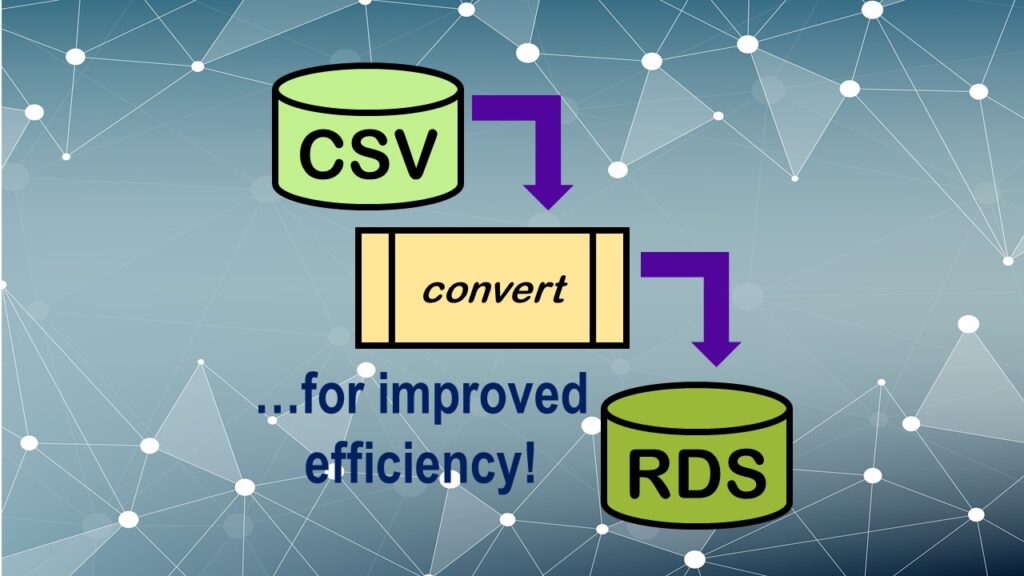
Convert CSV to RDS is what you want to do if you are working with big data files in R GUI and want to improve efficiency. Read my blog post for an explanation and video demonstrations of this process!

18
Feb
Feb
GPower case example shows a use-case where we needed to select an outcome measure for our study, then do a power calculation for sample size required under different outcome effect size scenarios. My blog post shows what I did, and how I documented/curated the results.
16
Feb
Feb
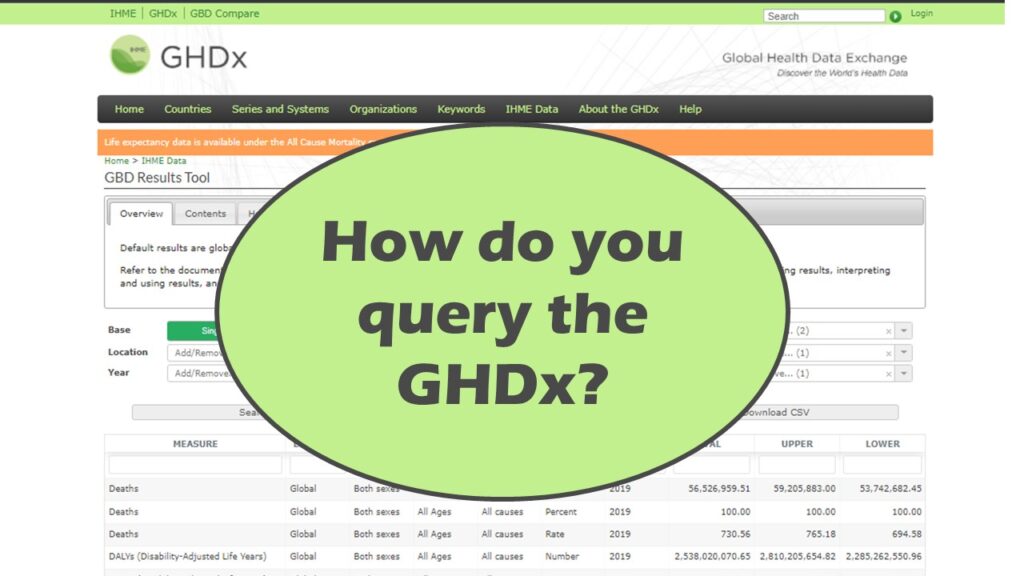
Querying the GHDx database is challenging because of its difficult user interface, but mastering it will allow you to access country-level health data for comparisons! See my demonstration!
- 1
- 2