
WISE Summit 2023 at Northeastern University was the biggest and best one so far! I was honored to lead a business intelligence workshop, as I talk about in my blog post.
Tag Archives: business operations
17
Oct
Oct
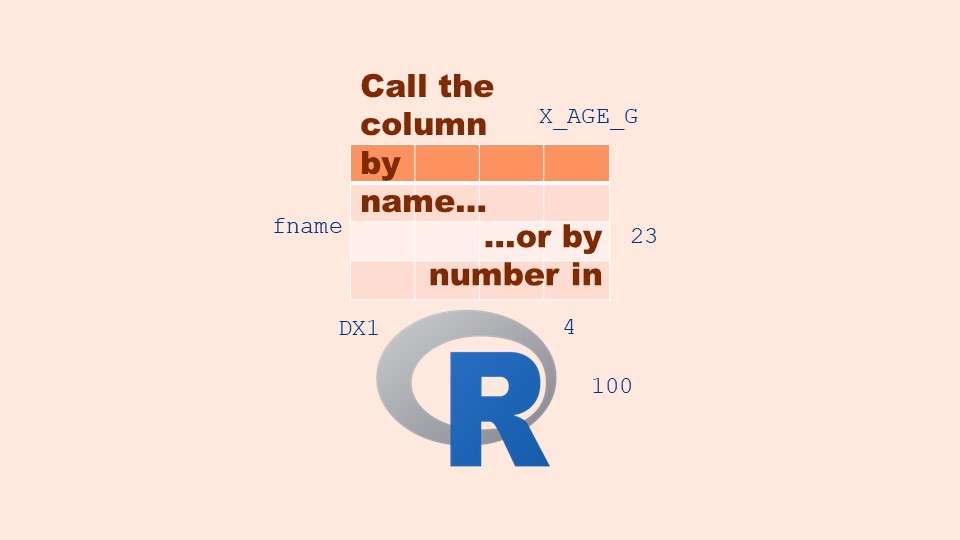
Referring to columns in R can be done using both number and field name syntax. Although field name syntax is easier to use in programming, my blog demonstrates how you can use column numbers to make automation easier.
12
Oct
Oct
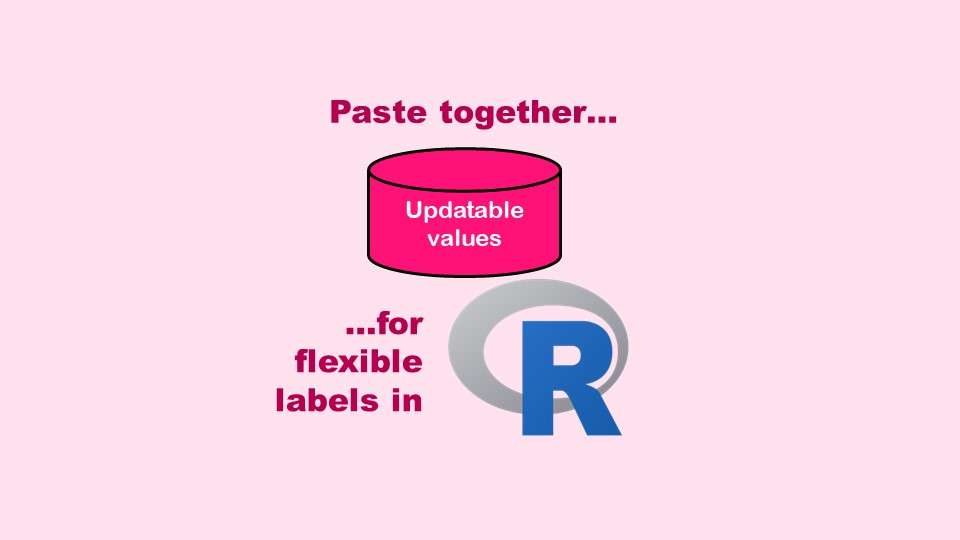
The paste command in R is used to concatenate strings. You can leverage the paste command to make refreshable label objects for reports and plots, as I describe in my blog post.

06
Jun
Jun
“AI on the edge” was a new term for me that I learned from Marc Staimer, founder of Dragon Slayer Consulting, who was interviewed in a podcast. Marc explained how AI on the edge poses a data storage problem, and my blog post proposes a solution!
20
Apr
Apr
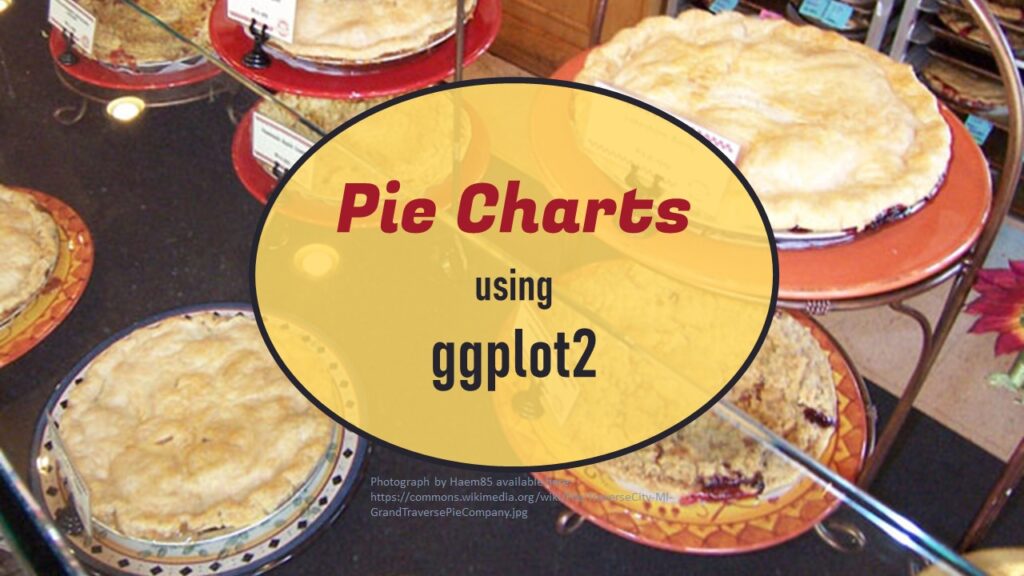
Pie chart ggplot style is surprisingly hard to make, mainly because ggplot2 did not give us a circle shape to deal with. But I explain how to get around it in my blog pot.
Quality Assurance/Quality Improvement (QA/QI)
“Bad Blood” Shows how Theranos was an Abject Failure in Data Stewardship: Part 3 of 5
28
Jun
Jun
The book “Bad Blood” describes the fall of startup unicorn Theranos, but also provides insight into the company’s abject failure at data stewardship, which I talk about in this blog post.

15
Dec
Dec
We experience artificial intelligence all the time on the internet in terms of friend suggestions on social media, internet ads that reflect what we have been searching for, and “smart” recommendations from online stores. But the reality is that even the people who build those formulas cannot usually explain why you were shown a certain […]