
“AI on the edge” was a new term for me that I learned from Marc Staimer, founder of Dragon Slayer Consulting, who was interviewed in a podcast. Marc explained how AI on the edge poses a data storage problem, and my blog post proposes a solution!
Tag Archives: r programming

03
Apr
Apr
Making upset plots with R package UpSetR is an easy way to visualize patterns of attributes in your data. My blog post demonstrates making patterns of co-morbidities in health survey respondents from the BRFSS, and walks you through setting text and color options in the code.
31
Mar
Mar
Making box plots in R affords you many different approaches and features. My blog post will show you easy ways to use both base R and ggplot2 to make box plots as you are proceeding with your data science projects.

18
Feb
Feb
GPower case example shows a use-case where we needed to select an outcome measure for our study, then do a power calculation for sample size required under different outcome effect size scenarios. My blog post shows what I did, and how I documented/curated the results.
Data Science
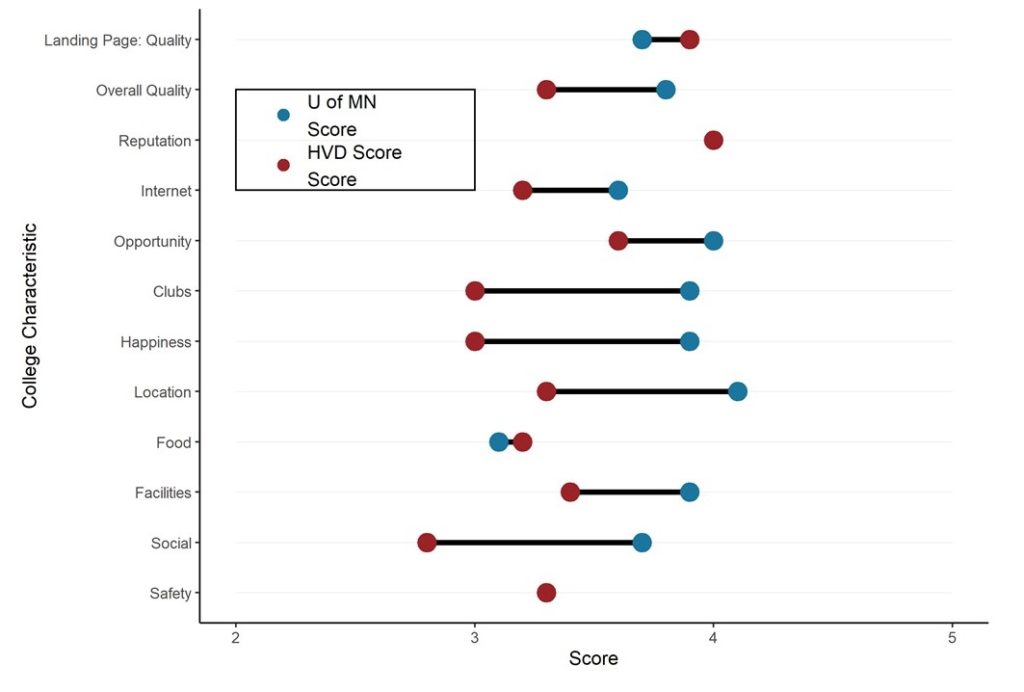
Dumbbell Plot for Comparison of Rated Items: Which is Rated More Highly – Harvard or the U of MN?
20
Sep
Sep
Want to compare multiple rankings on two competing items – like hotels, restaurants, or colleges? I show you an example of using a dumbbell plot for comparison in R with the ggalt package for this exact use-case!