Tag Archives: data protection

ETL Pipeline Documentation: Here are my Tips and Tricks!

This blog post shows you how to properly document your extract, transform, and load code.

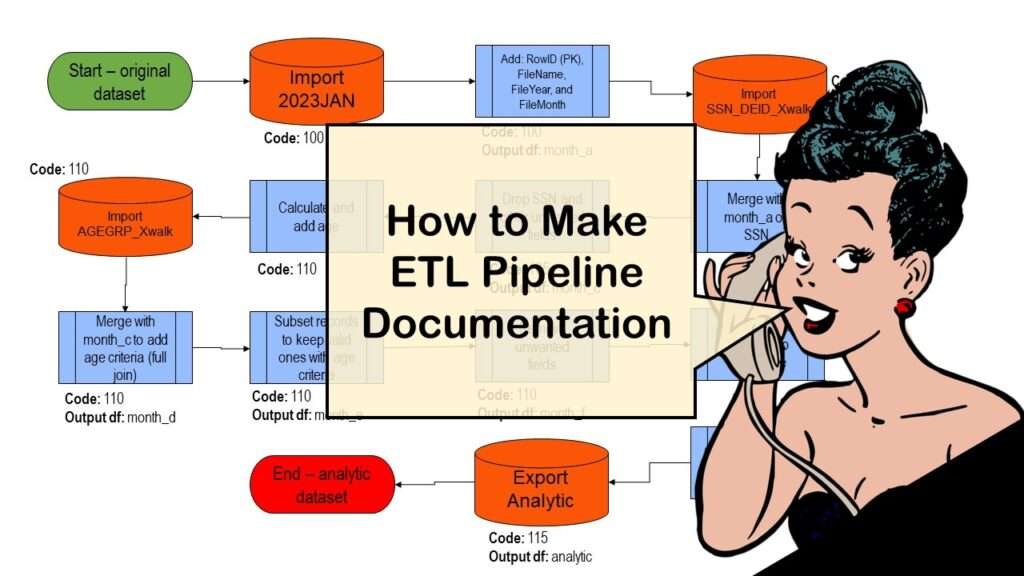
ETL pipeline documentation is great for team communication as well as data stewardship! Read my blog post to learn my tips and tricks.

Pie Chart ggplot Style is Surprisingly Hard! Here’s How I Did it

How do you make a pie chart in ggplot2 package in R? It's not that obvious

Pie chart ggplot style is surprisingly hard to make, mainly because ggplot2 did not give us a circle shape to deal with. But I explain how to get around it in my blog pot.

Data Curation Solution to Confusing Options in R Package UpSetR

It is possible to use data curation to solve the problem of a confusion vector containing options.

Data curation solution that I posted recently with my blog post showing how to do upset plots in R using the UpSetR package was itself kind of a masterpiece. Therefore, I thought I’d dedicate this blog post to explaining how and why I did it.

Making Box Plots Different Ways is Easy in R!

There are two main ways to make box plots in R, and this blog post shows you how, and explains the differences.

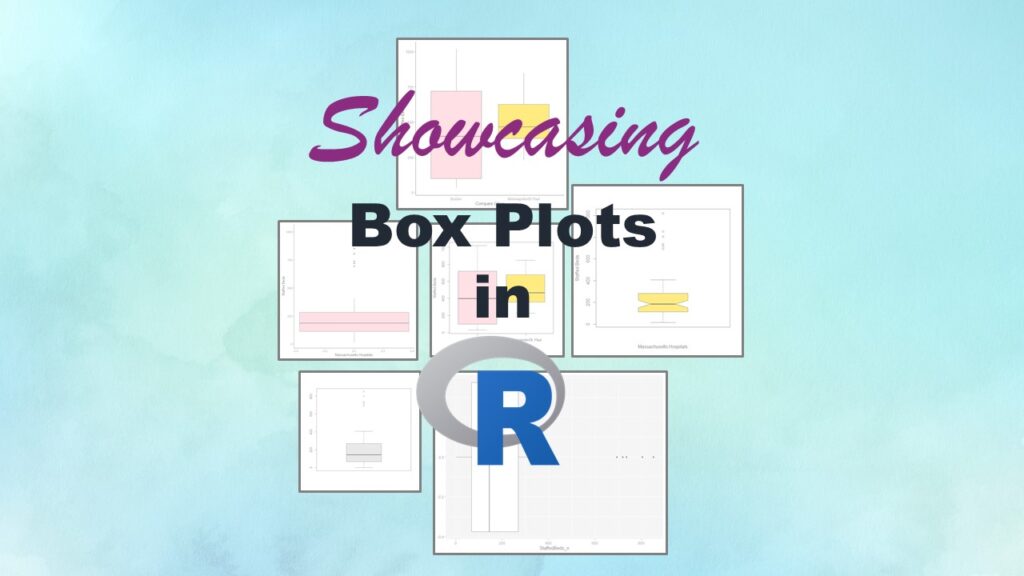
Making box plots in R affords you many different approaches and features. My blog post will show you easy ways to use both base R and ggplot2 to make box plots as you are proceeding with your data science projects.

Convert CSV to RDS When Using R for Easier Data Handling

If you want to use R for a project and the source CSV is very big, it can improve input/output efficiency to convert the file to an RDS.

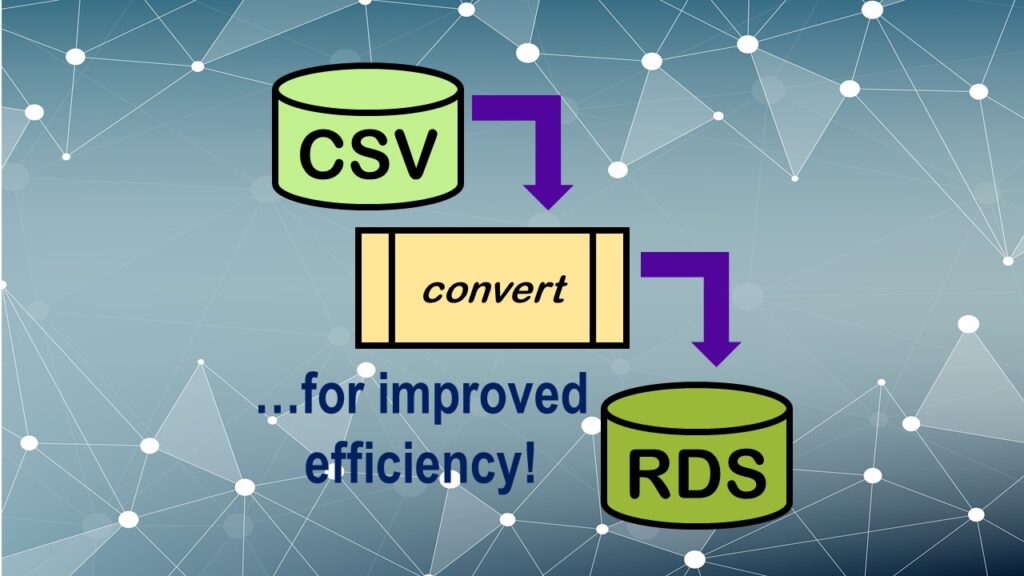
Convert CSV to RDS is what you want to do if you are working with big data files in R GUI and want to improve efficiency. Read my blog post for an explanation and video demonstrations of this process!

Referring to Variables in Processing Data is Different in SAS Compared to R

When doing data processing, especially extract-transform-load (ETL) into a data warehouse, you might need to refer to the variables in your code, and it's done differently in SAS vs. R.

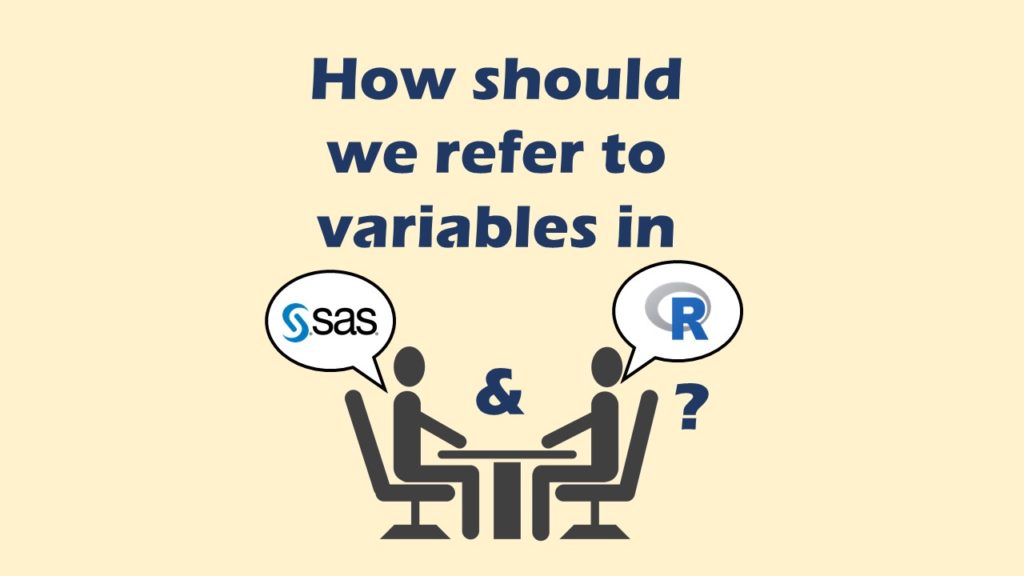
Referring to variables in processing is different conceptually when thinking about SAS compared to R. I explain the differences in my blog post.

Counting Rows in SAS and R Use Totally Different Strategies

If you are a data scientist working with large datasets, you need to learn the commands to count both columns and rows in the dataset, whether you are using SAS or R.

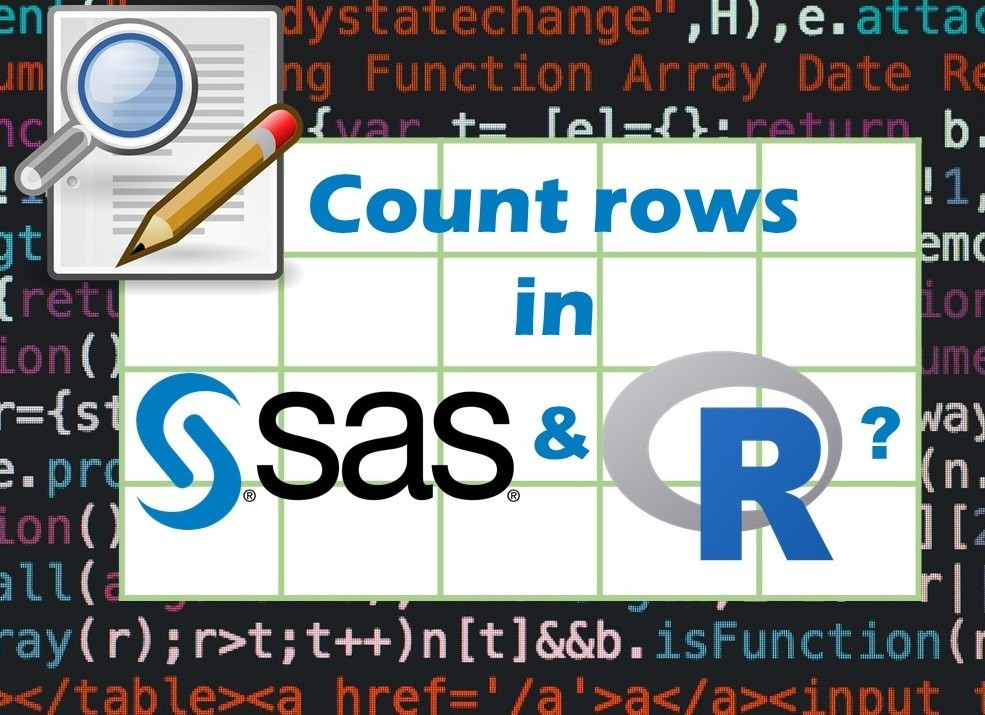
Counting rows in SAS and R is approached differently, because the two programs process data in different ways. Read my blog post where I describe both ways.

Native Formats in SAS and R for Data Are Different: Here’s How!

Why use particular data formats for different programming languages in statistics? Because the programs can then process the data faster and with more accuracy.

Native formats in SAS and R of data objects have different qualities – and there are reasons behind these differences. Learn about them in this blog post!

Data Scientists Interested in Encryption Should Take this Online Cryptography Course

Cartoon of person programming with code in the background

Even if you do not deal directly with cryptography, the need to maintain data privacy often leads data scientists to need to study cryptography. This basic online course is part of an ethical hacking certification and gives a basic overview of issues with data transfer and cryptography.

Verified by MonsterInsights