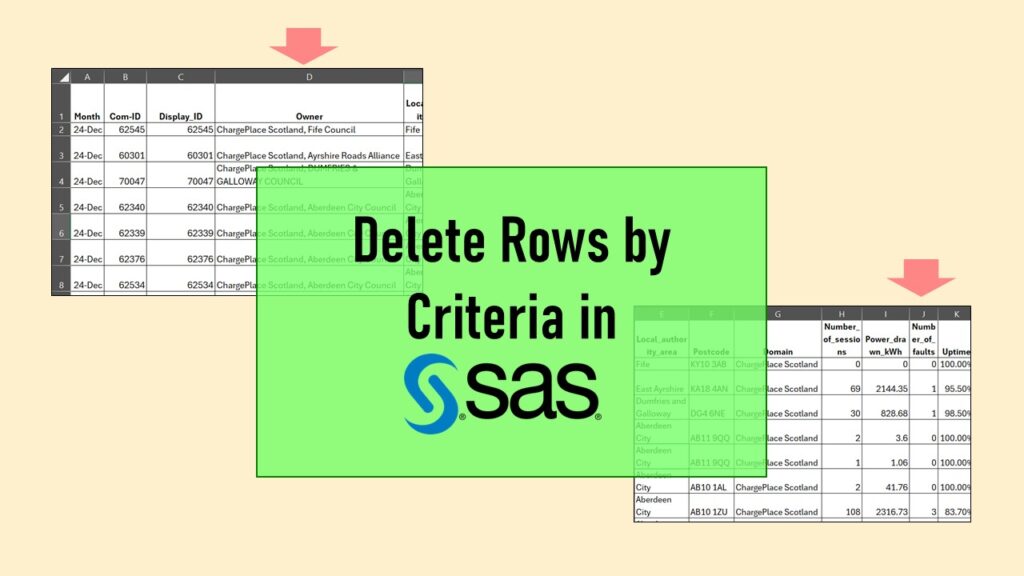
Delete if rows meet a certain criteria is a common approach to paring down a dataset. Read my blog for an example in SAS!
Tag Archives: data warehousing in SAS

30
Jul
Jul
Connecting SAS to other applications is often necessary, and there are many ways to do it. Read this blog post for a couple of use-cases of SAS data integration using various SAS components.

25
Jun
Jun
Project management terminology is often used around epidemiologists, biostatisticians, and health data scientists, and it’s often hard for us to admit we aren’t familiar with some of the terms. Watch my videos and take my Applications Basics course to get up to speed with vocabulary from the health application development domain.

19
Jun
Jun
Understanding legacy data is necessary if you want to analyze datasets that are extracted from old systems. This knowledge is still relevant, as we still use these old systems today, as I discuss in my blog post.

13
Jun
Jun
Reducing query cost is especially important in SAS – but do you know how to do it, or what it even means? Read my blog post to learn why this is important in health data analytics.

11
Oct
Oct
Adding error bars to ggplot2 in R plots is easiest if you include the width of the error bar as a variable in your plot data. Read my blog post to see an example.
16
Feb
Feb
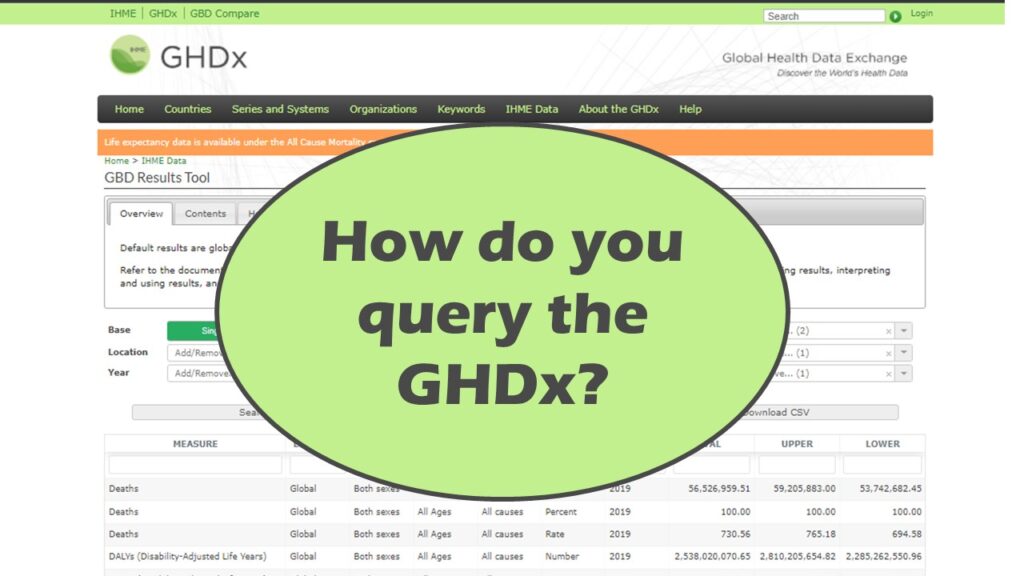
Querying the GHDx database is challenging because of its difficult user interface, but mastering it will allow you to access country-level health data for comparisons! See my demonstration!

04
Feb
Feb
Variable names in SAS and R are subject to different “rules and regulations”, and these can be leveraged to your advantage, as I describe in this blog post.
28
Jan
Jan
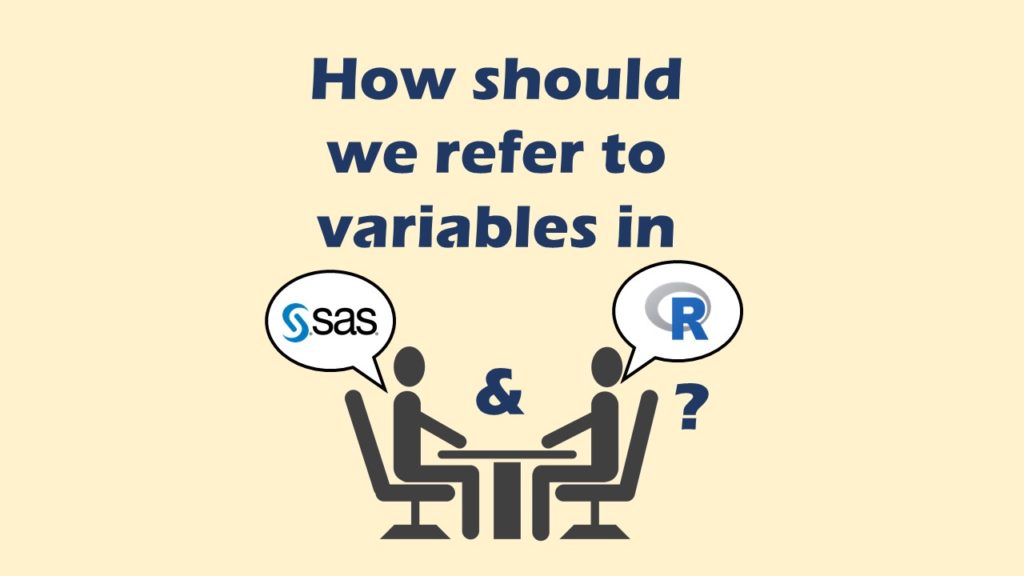
Referring to variables in processing is different conceptually when thinking about SAS compared to R. I explain the differences in my blog post.

20
Jan
Jan
Interview preparation for data science jobs can involve taking several simple, actionable steps to make yourself feel confident and ready to answer questions with ease. Read my blog post for my tips and tricks!