
Wiley’s predatory behavior recently with a colleague’s scientific manuscript makes me want to avoid publishing in their journals. Read about our experience.
Tag Archives: open source
20
Apr
Apr
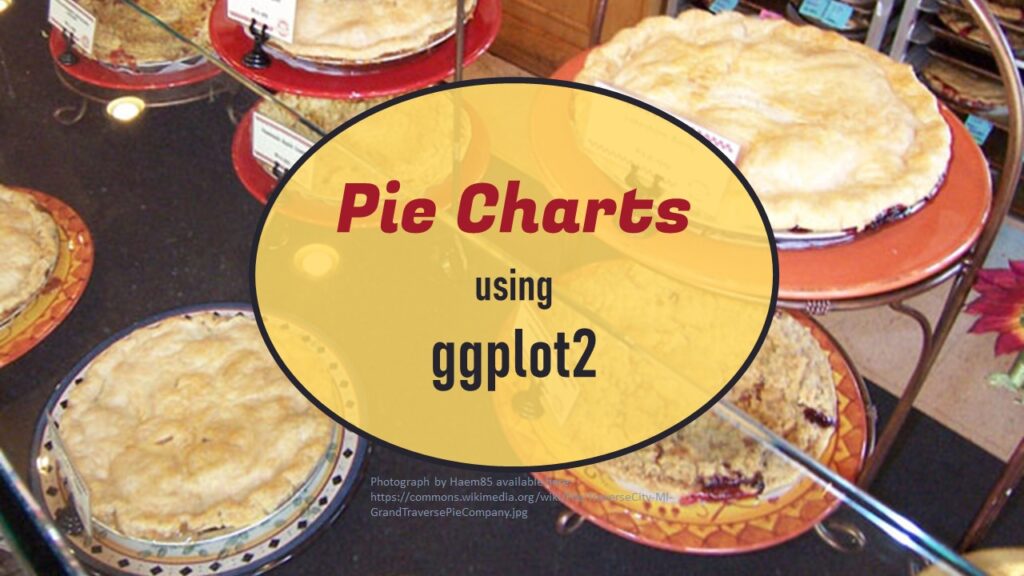
Pie chart ggplot style is surprisingly hard to make, mainly because ggplot2 did not give us a circle shape to deal with. But I explain how to get around it in my blog pot.

18
Feb
Feb
GPower case example shows a use-case where we needed to select an outcome measure for our study, then do a power calculation for sample size required under different outcome effect size scenarios. My blog post shows what I did, and how I documented/curated the results.
04
Feb
Feb
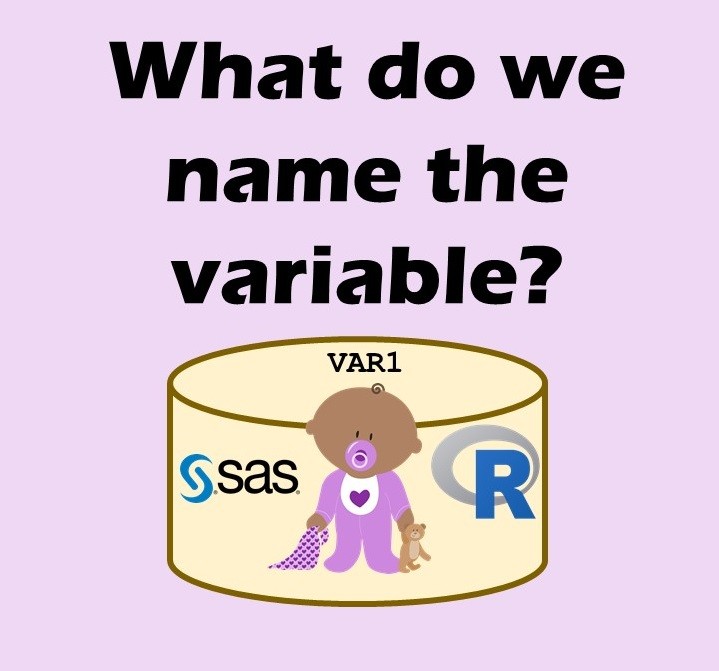
Variable names in SAS and R are subject to different “rules and regulations”, and these can be leveraged to your advantage, as I describe in this blog post.
07
Jan
Jan
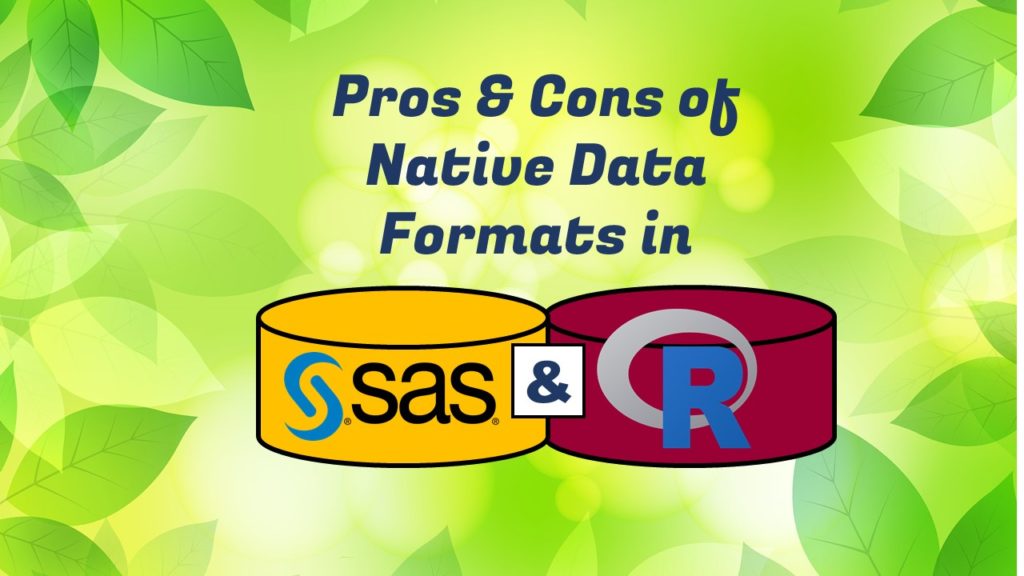
Native formats in SAS and R of data objects have different qualities – and there are reasons behind these differences. Learn about them in this blog post!
14
Mar
Mar
With all this talk about “flattening the curve” of the coronavirus, I thought I would get into the weeds about what curve we are talking about when we say that. We are talking about what’s called an epidemiologic curve, or epicurve for short. And to demonstrate what an epicurve is and what it means, I […]