
Descriptive analysis of Black Friday Death Count Database provides an example of how creative classification can make a quick and easy data science portfolio project!
Tag Archives: infectious disease

24
Nov
Nov
Classification crosswalks are easy to make, and can help you reduce cardinality in categorical variables, making for insightful data science portfolio projects with only descriptive statistics. Read my blog post for guidance!

22
Nov
Nov
Wiley’s predatory behavior recently with a colleague’s scientific manuscript makes me want to avoid publishing in their journals. Read about our experience.
14
Mar
Mar
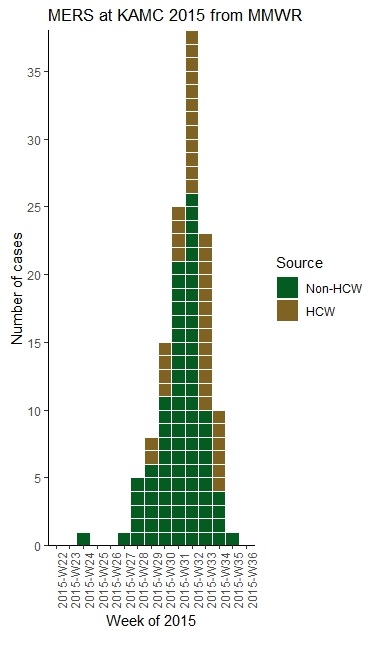
With all this talk about “flattening the curve” of the coronavirus, I thought I would get into the weeds about what curve we are talking about when we say that. We are talking about what’s called an epidemiologic curve, or epicurve for short. And to demonstrate what an epicurve is and what it means, I […]