Make categorical variables by cutting up continuous ones. But where to put the boundaries? Get advice on my blog!
Tag Archives: epidemiologic inference
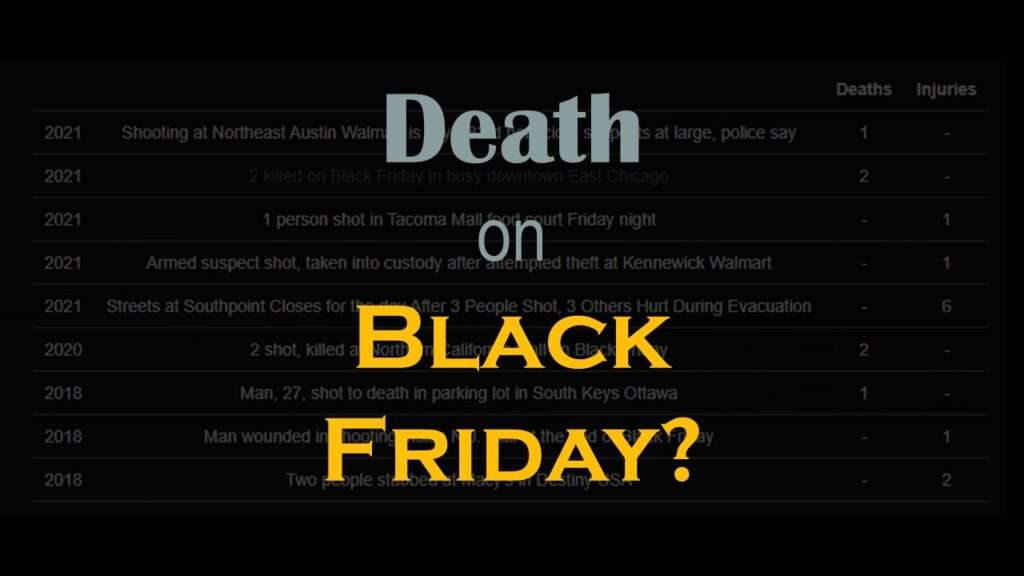
Descriptive analysis of Black Friday Death Count Database provides an example of how creative classification can make a quick and easy data science portfolio project!
Classification crosswalks are easy to make, and can help you reduce cardinality in categorical variables, making for insightful data science portfolio projects with only descriptive statistics. Read my blog post for guidance!
Internship strategy for data science is not obvious, and even if you are in a college program, they often expect you to find your own internship. Download our internship strategy guide and get the experience you want!
You may already know that NACCHO is NOT cheese – but what is it? It’s a professional society for local public health officials. Read my blog post to learn what NACCHO does, and who it serves.
What is the VA – which stands for Veterans Affairs? This United States federal agency is tasked with ensuring veterans receive their benefits – especially health benefits. Unfortunately, as my blog post explains, the VA is facing a myriad of challenges today, including funding problems as well as corruption.
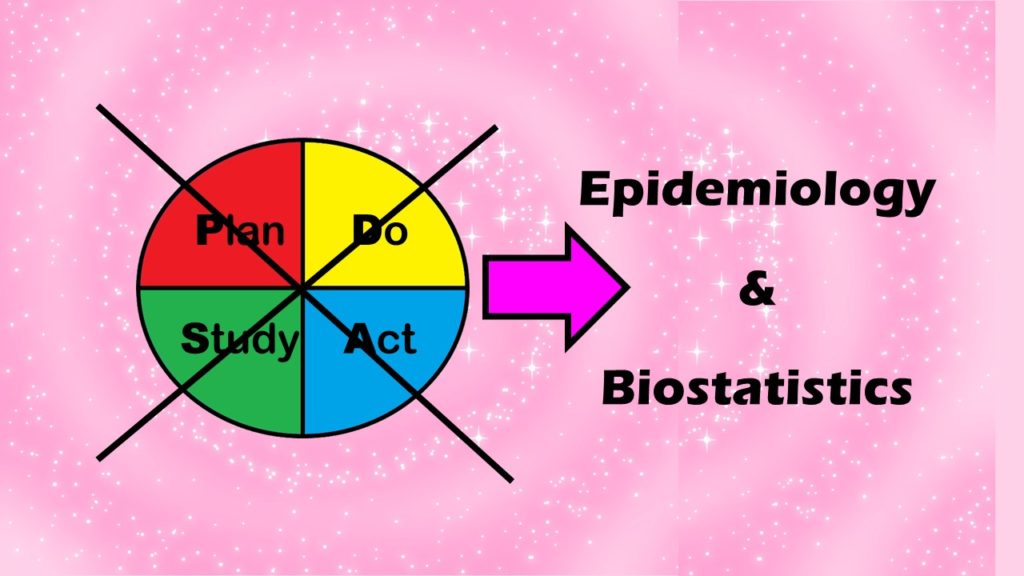
I describe the three steps of my alternative model to the Plan-Do-Study-Act (PDSA) model for quality assurance/quality improvement (QA/QI) in healthcare.
If you are learning epidemiology or refreshing your memory of your formal study of it, you always want to have credible scientific definitions at hand of terms such as “measures of association”. Read my blog post for quick links to Boston University’s online educational module!

