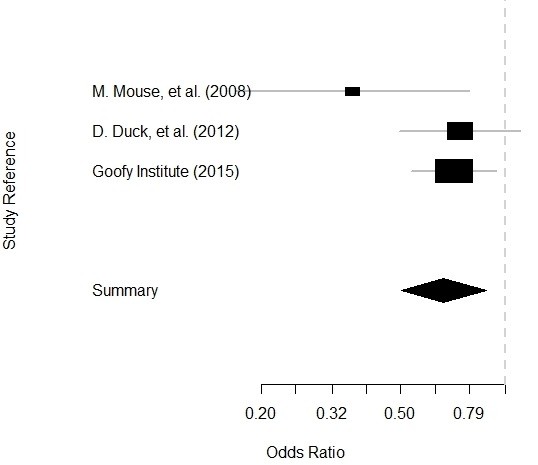
Getting data for meta-analysis together can be challenging, so I walk you through the simple steps I take, starting with the scientific literature, and ending with a gorgeous and evidence-based Forrest plot!
Tag Archives: publishing
Quality Assurance/Quality Improvement (QA/QI)
Recommended Model for QA/QI in Healthcare: Epidemiology and Biostatistics, not PDSA! Part 5 of 5
14
Jul
Jul
I describe the three steps of my alternative model to the Plan-Do-Study-Act (PDSA) model for quality assurance/quality improvement (QA/QI) in healthcare.
Quality Assurance/Quality Improvement (QA/QI)
Alternative to the PDSA Model for QA/QI in Healthcare? Old-fashioned Epidemiology and Biostatistics! Part 4 of 5
07
Jul
Jul
Want an alternative to the Plan-Do-Study-Act (PDSA) model for quality assurance/quality improvement (QA/QI) in healthcare? I recommend approaching QA/QI a different way, by thinking about the various functions of the QA/QI department.

30
Jun
Jun
The Plan-Do-Study-Act model is promoted for quality assurance/quality improvement in healthcare. But does it have any peer-reviewed evidence base behind it? I examine that in this blog post.

05
Dec
Dec
Lipedema, a severe metabolic disorder, is more common than originally thought. A non-trivial proportion of women who struggle with obesity actually have undiagnosed lipedema. I am on a research team that just published a peer-reviewed article that presents the ketogenic hypothesis for lipedema, and here, I present a summary.
11
Oct
Oct
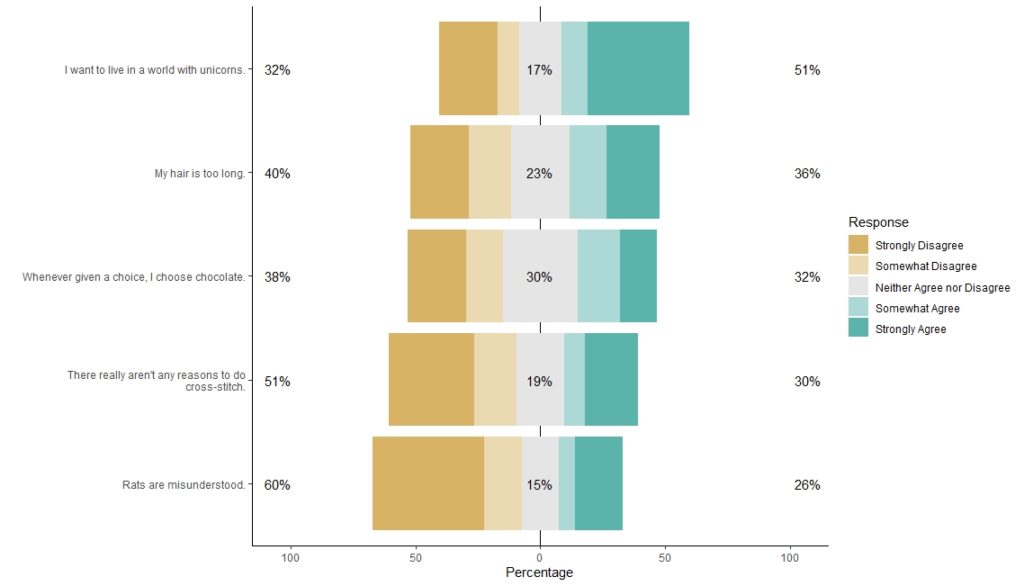
I love the Likert package in R, and use it often to visualize data. The problem is that sometimes, I have sparse data, and this can cause problems with the package. This blog post shows you a workaround, and also, a way to format the final plot that I think looks really great!
Public Health
Here is the Statistical Reason why Calculating the Coronavirus Mortality Rate is so Difficult
07
Mar
Mar
Since the coronavirus (COVID-19) registered on our public health radar as a communicable infectious disease amongst humans, countries try to calculate their coronavirus mortality rate (otherwise known as case fatality rate). As a result, many different mortality rates have been reported, causing confusion. This article from Business Insider reports country-wide mortality rates that range from […]
Career Development
Physical College Classrooms are so Yesterday. Why Are We Still Studying Deeper Learning in Face-to-Face Settings?

17
Feb
Feb
My colleague who is a professor at Fitchburg State University studies deeper learning in face-to-face and online approaches in higher education. The idea is that if educators use deeper learning approaches, the students will learn more efficiently. Others have talked to me about deeper learning, and when I looked into it, I found that the […]
Career Development
What is Open Access Publishing in Scientific Journals and Why Should I Pay for it?

31
Aug
Aug
If you believe in open source software, then you probably also agree with open source publishing. Why is it so expensive compared to open source software? My blog post has the answers.