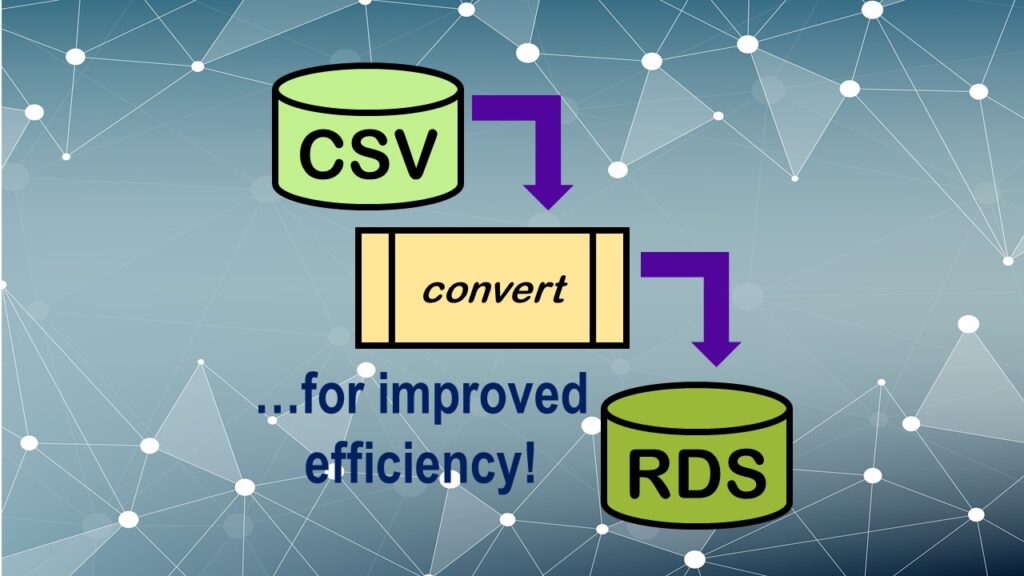
Convert CSV to RDS is what you want to do if you are working with big data files in R GUI and want to improve efficiency. Read my blog post for an explanation and video demonstrations of this process!
Tag Archives: r software

18
Feb
Feb
GPower case example shows a use-case where we needed to select an outcome measure for our study, then do a power calculation for sample size required under different outcome effect size scenarios. My blog post shows what I did, and how I documented/curated the results.
16
Feb
Feb
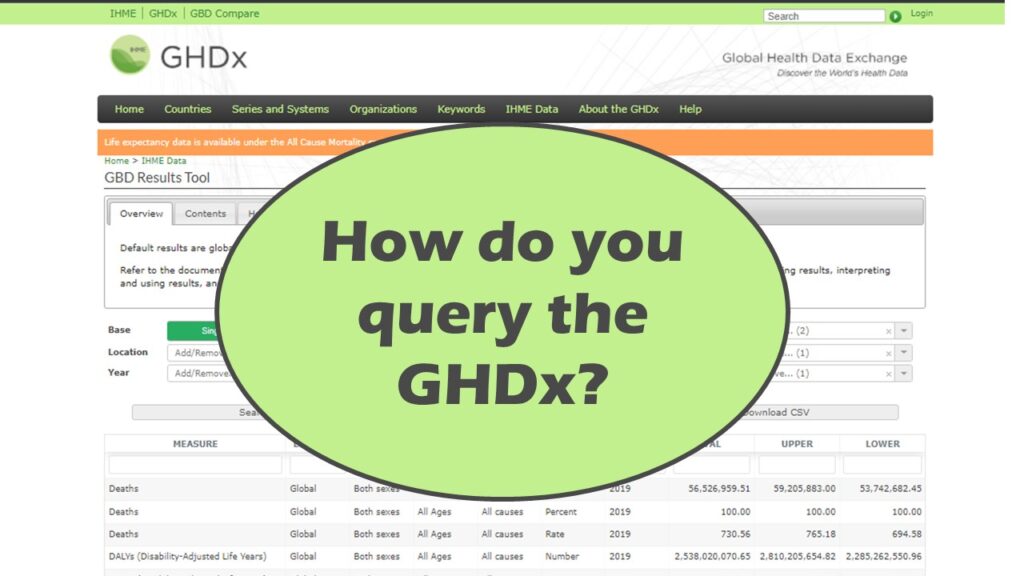
Querying the GHDx database is challenging because of its difficult user interface, but mastering it will allow you to access country-level health data for comparisons! See my demonstration!
07
Jan
Jan
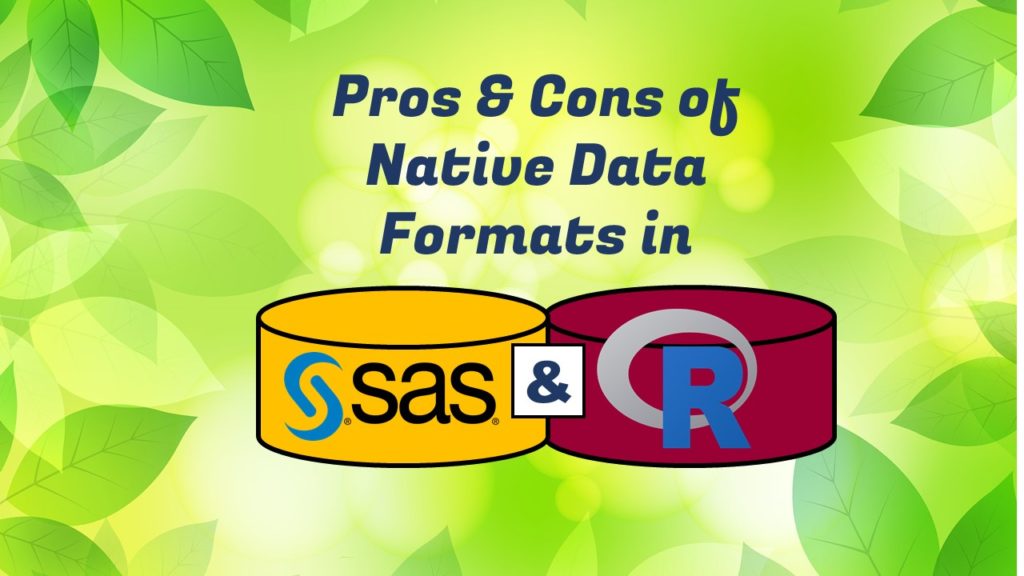
Native formats in SAS and R of data objects have different qualities – and there are reasons behind these differences. Learn about them in this blog post!
26
Dec
Dec
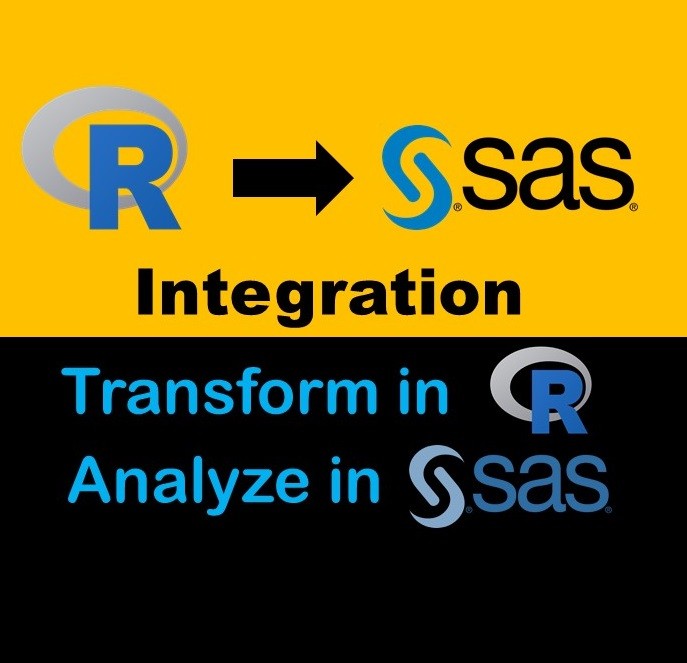
Looking for a SAS-R integration example that uses the best of both worlds? I show you a use-case where I was in a hurry, and did transformation in R with the analysis in SAS!

20
Oct
Oct
SAS is known for big data and data warehousing, but how do you actually design and build a SAS data warehouse or data lake? What datasets do you include? How do you transform them? How do you serve warehouse users? How do you manage your developers? This book has your answers!
19
Oct
Oct
Curation files are especially helpful for communicating about data on teams. Learn more about what you’ll learn when you take my online LinkedIn Learning data curation course!
11
Oct
Oct
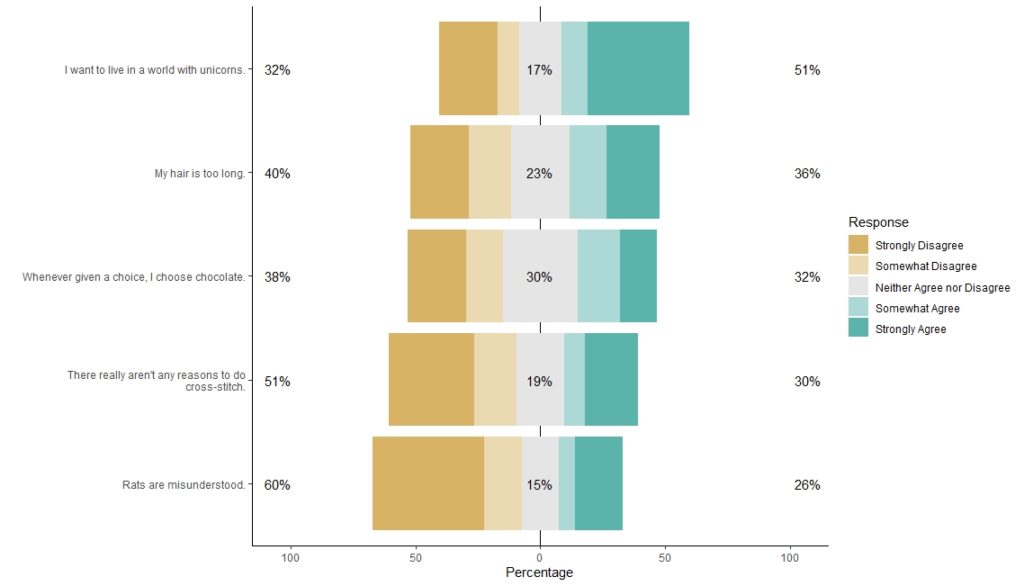
I love the Likert package in R, and use it often to visualize data. The problem is that sometimes, I have sparse data, and this can cause problems with the package. This blog post shows you a workaround, and also, a way to format the final plot that I think looks really great!
14
Mar
Mar
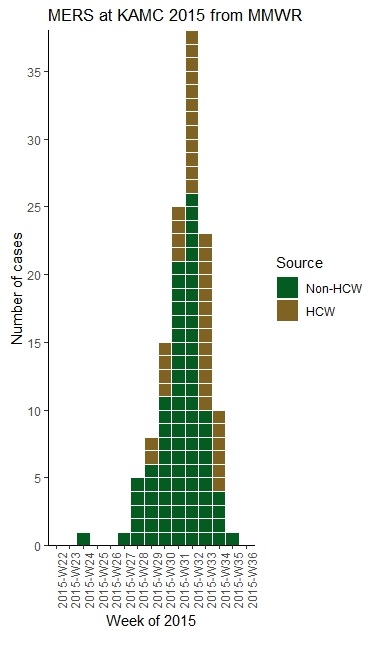
With all this talk about “flattening the curve” of the coronavirus, I thought I would get into the weeds about what curve we are talking about when we say that. We are talking about what’s called an epidemiologic curve, or epicurve for short. And to demonstrate what an epicurve is and what it means, I […]