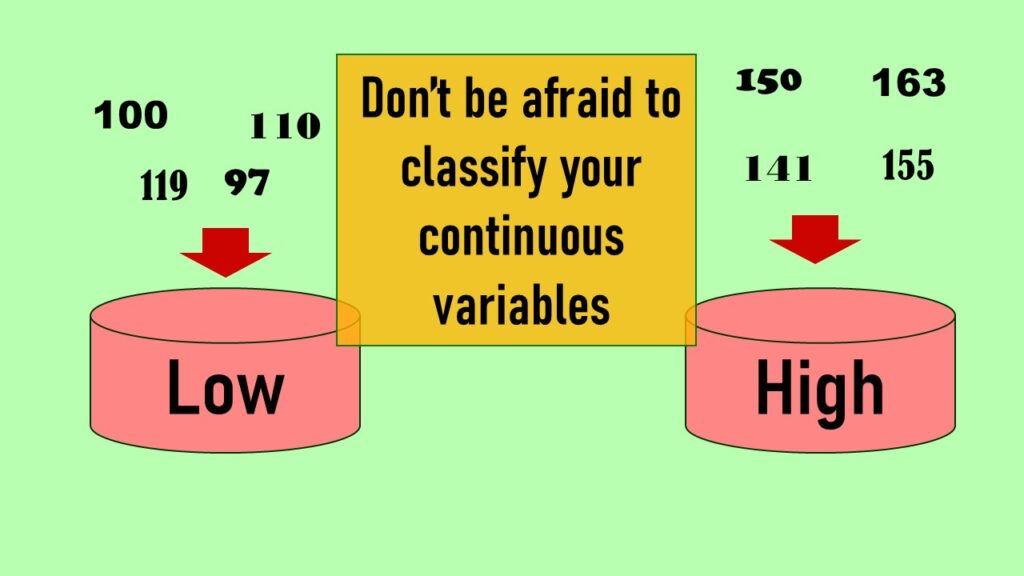
Continuous variable categorized can open up a world of possibilities for analysis. Read about it on my blog!
Tag Archives: box plots
05
May
May
Identify elements in research reports, and you’ll be able to understand them much more easily. My blog post shows you how!

11
Apr
Apr
Time series plots in R are totally customizable using the ggplot2 package, and can come out with a look that is clean and sharp. However, you usually end up fighting with formatting the x-axis and other options, and I explain in my blog post.
31
Mar
Mar
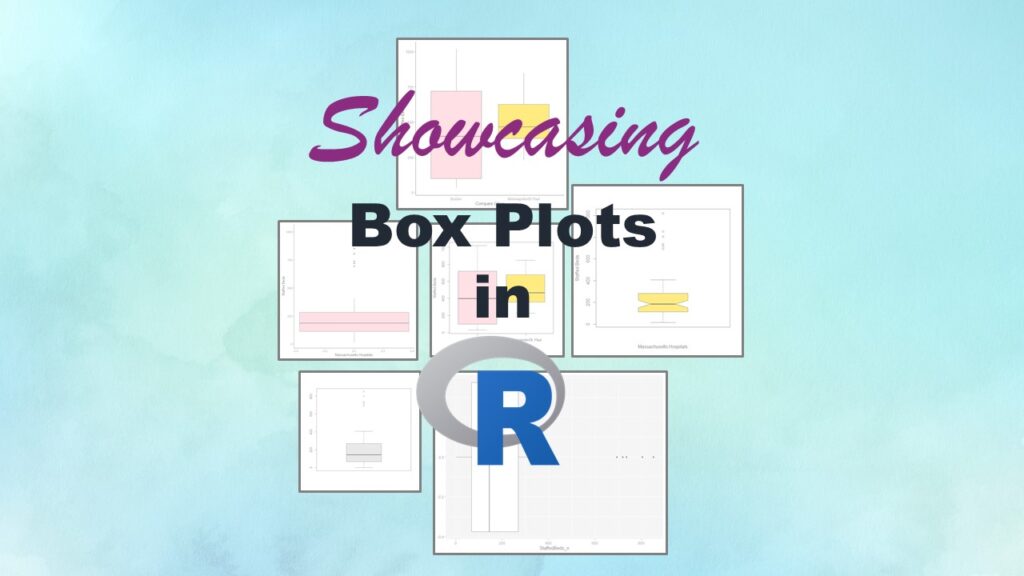
Making box plots in R affords you many different approaches and features. My blog post will show you easy ways to use both base R and ggplot2 to make box plots as you are proceeding with your data science projects.
19
Oct
Oct
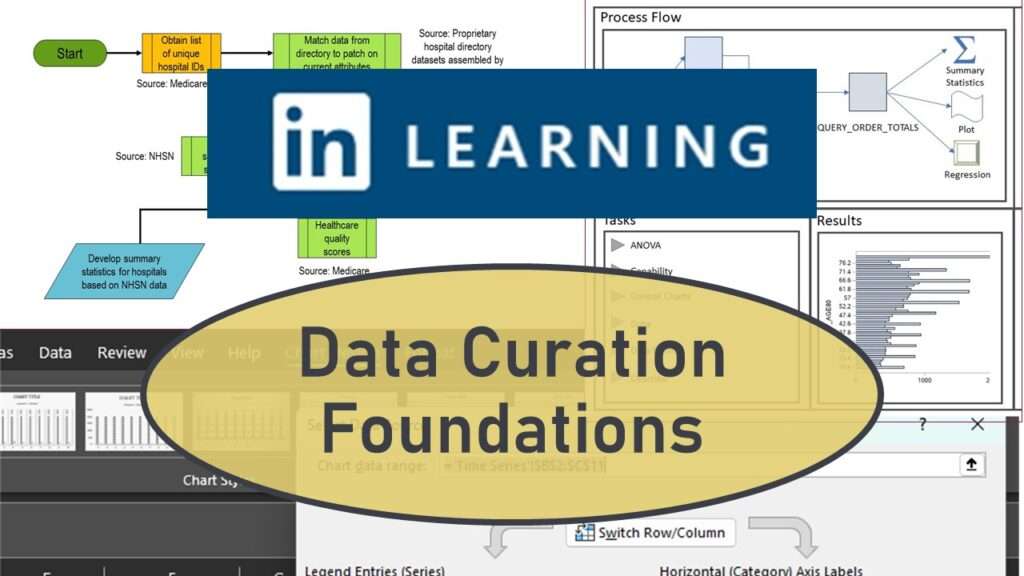
Curation files are especially helpful for communicating about data on teams. Learn more about what you’ll learn when you take my online LinkedIn Learning data curation course!