NHANES data piqued your interest? It’s not all sunshine and roses. Read my blog post to see the pitfalls of NHANES data, and get practical advice about using them in a project.
Tag Archives: data science program

23
Mar
Mar
Management tips for data scientists can be used by anyone – at work and in your personal life! Get the details in my blog post.
07
Mar
Mar
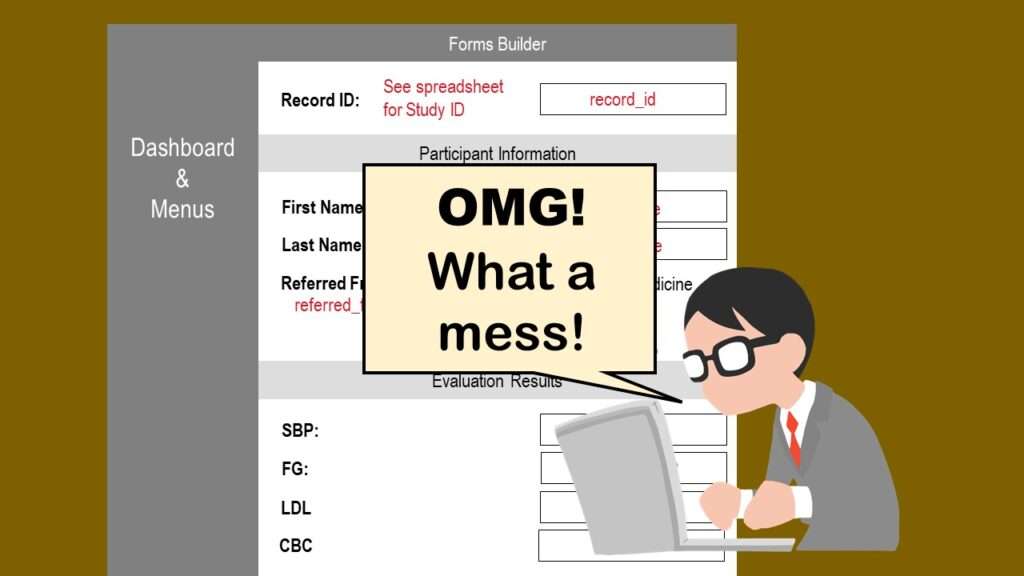
REDCap mess happens often in research shops, and it’s an analysis showstopper! Read my blog post to learn my secret tricks for breaking through the barriers and getting on with data analytics!
22
Feb
Feb
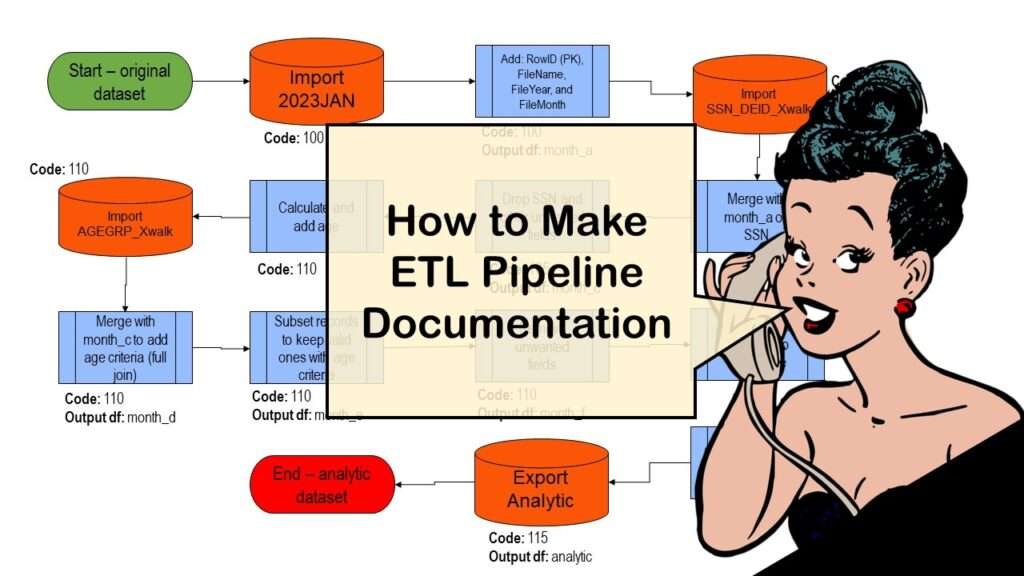
ETL pipeline documentation is great for team communication as well as data stewardship! Read my blog post to learn my tips and tricks.

06
Jun
Jun
“AI on the edge” was a new term for me that I learned from Marc Staimer, founder of Dragon Slayer Consulting, who was interviewed in a podcast. Marc explained how AI on the edge poses a data storage problem, and my blog post proposes a solution!

22
Apr
Apr
“What is the IHS?” is a reasonable question to ask, because there are a few things that are very special about the IHS and its healthcare facilities. At first glance, these special characteristics may seem positive, but they actually have devastating unintended consequences, as I describe in my blog post.
31
Mar
Mar
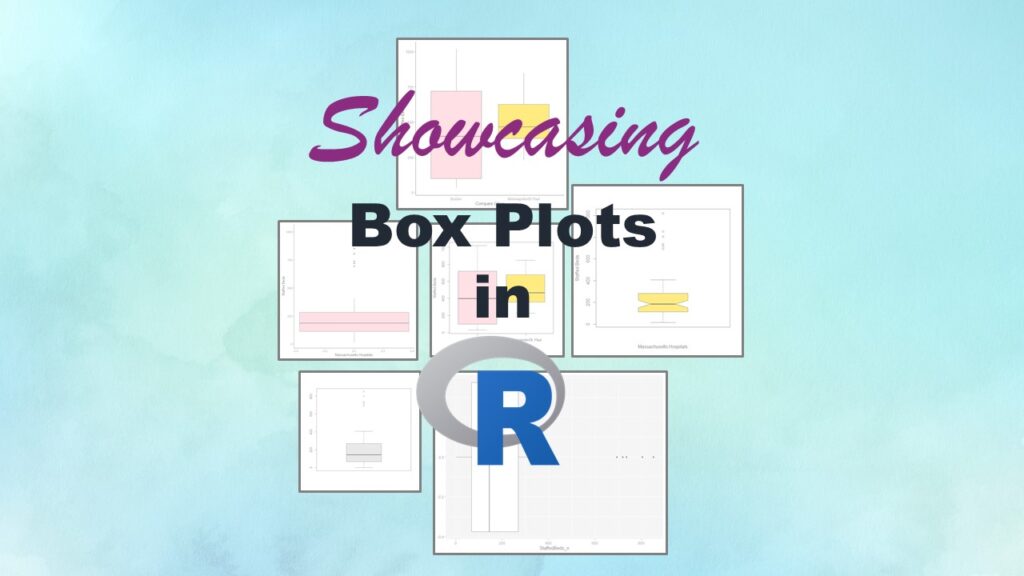
Making box plots in R affords you many different approaches and features. My blog post will show you easy ways to use both base R and ggplot2 to make box plots as you are proceeding with your data science projects.
25
Mar
Mar
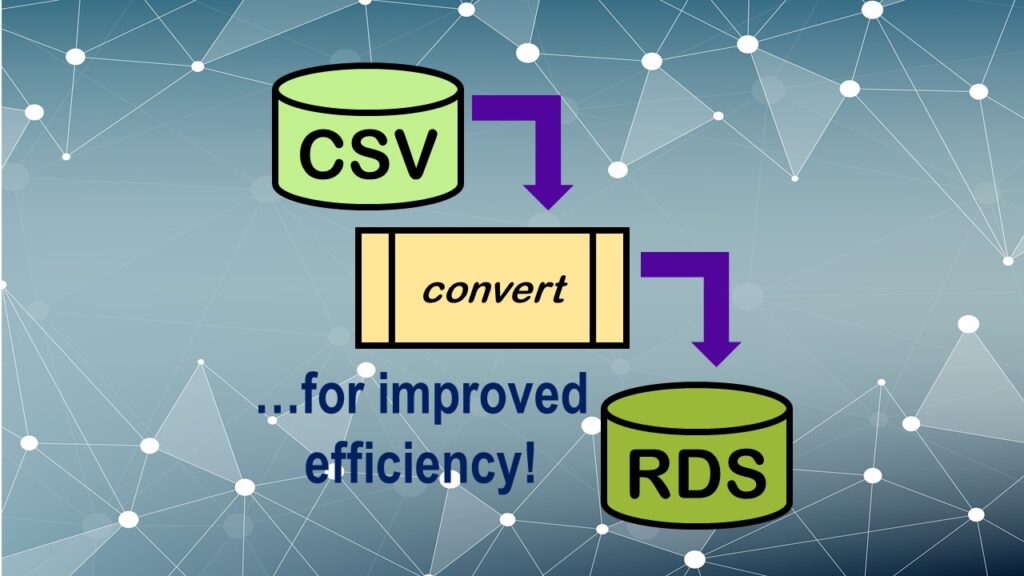
Convert CSV to RDS is what you want to do if you are working with big data files in R GUI and want to improve efficiency. Read my blog post for an explanation and video demonstrations of this process!

18
Feb
Feb
GPower case example shows a use-case where we needed to select an outcome measure for our study, then do a power calculation for sample size required under different outcome effect size scenarios. My blog post shows what I did, and how I documented/curated the results.
04
Feb
Feb
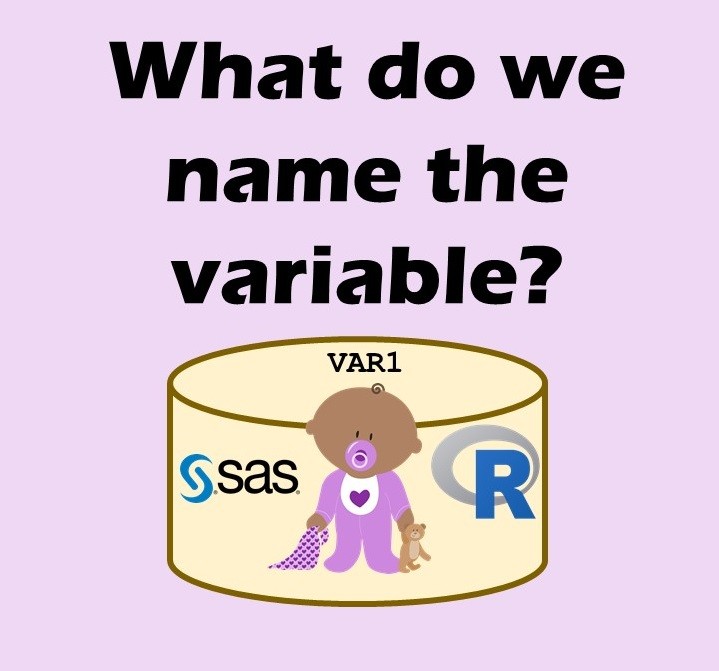
Variable names in SAS and R are subject to different “rules and regulations”, and these can be leveraged to your advantage, as I describe in this blog post.
- 1
- 2