NHANES data piqued your interest? It’s not all sunshine and roses. Read my blog post to see the pitfalls of NHANES data, and get practical advice about using them in a project.
Tag Archives: diagrams of processes
04
Oct
Oct
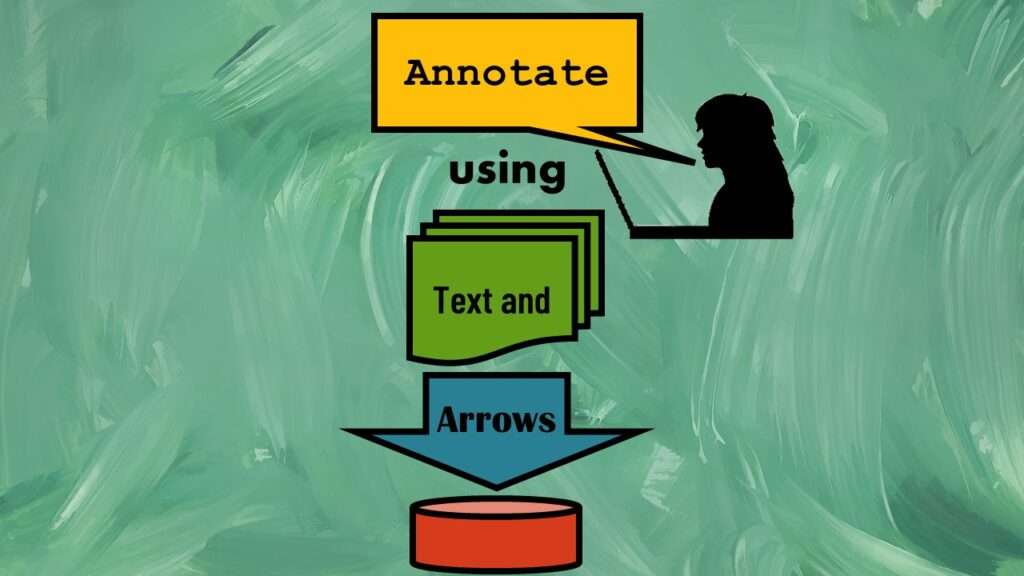
Text and arrows in dataviz, if used wisely, can help your audience understand something very abstract, like a data pipeline. Read my blog post for tips in choosing images for your data visualizations!