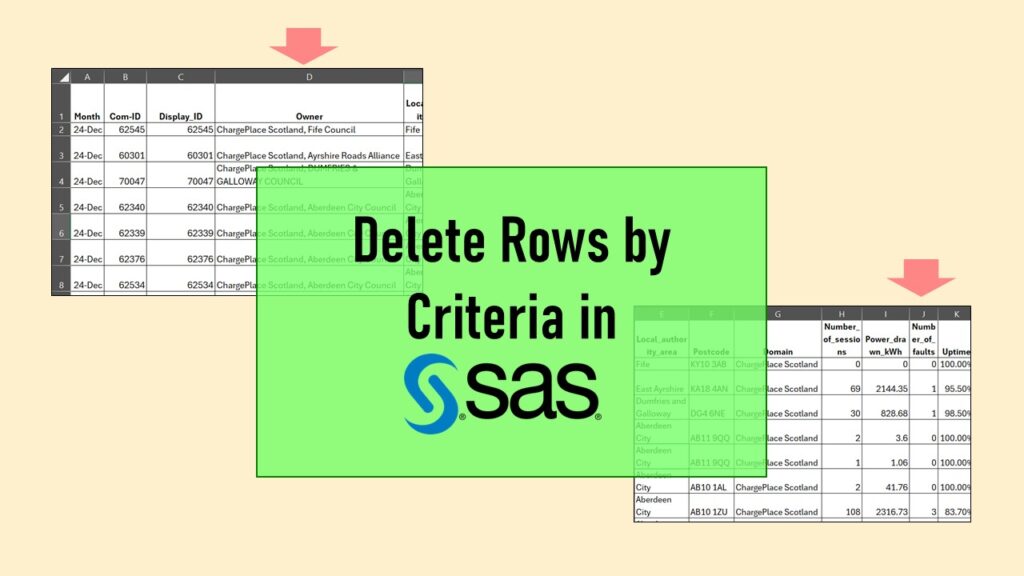
Delete if rows meet a certain criteria is a common approach to paring down a dataset. Read my blog for an example in SAS!
Tag Archives: Association of Schools and Programs in Public Health
27
Nov
Nov
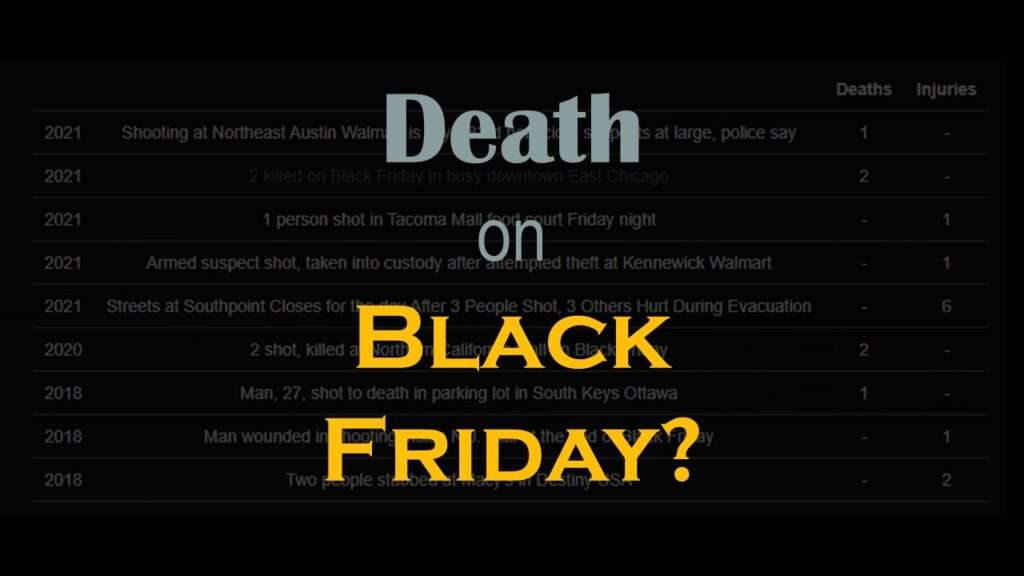
Descriptive analysis of Black Friday Death Count Database provides an example of how creative classification can make a quick and easy data science portfolio project!

07
Nov
Nov
Joins in base R must be executed properly or you will lose data. Read my tutorial on how to correctly execute left joins in base R.
02
Nov
Nov
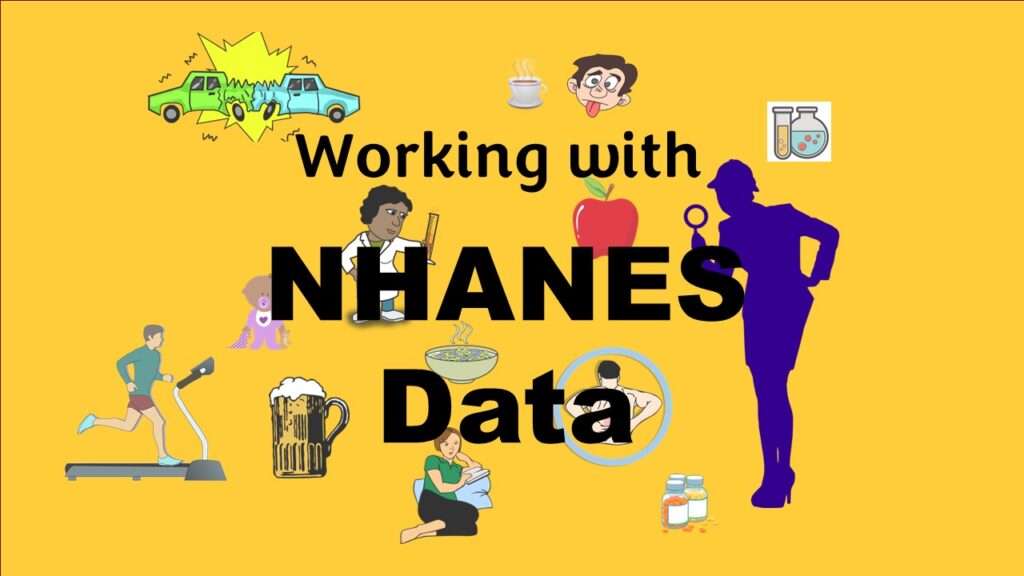
NHANES data piqued your interest? It’s not all sunshine and roses. Read my blog post to see the pitfalls of NHANES data, and get practical advice about using them in a project.

09
Oct
Oct
Color in visualizations of data curation and other data science documentation can be used to enhance communication – I show you how!
04
Oct
Oct
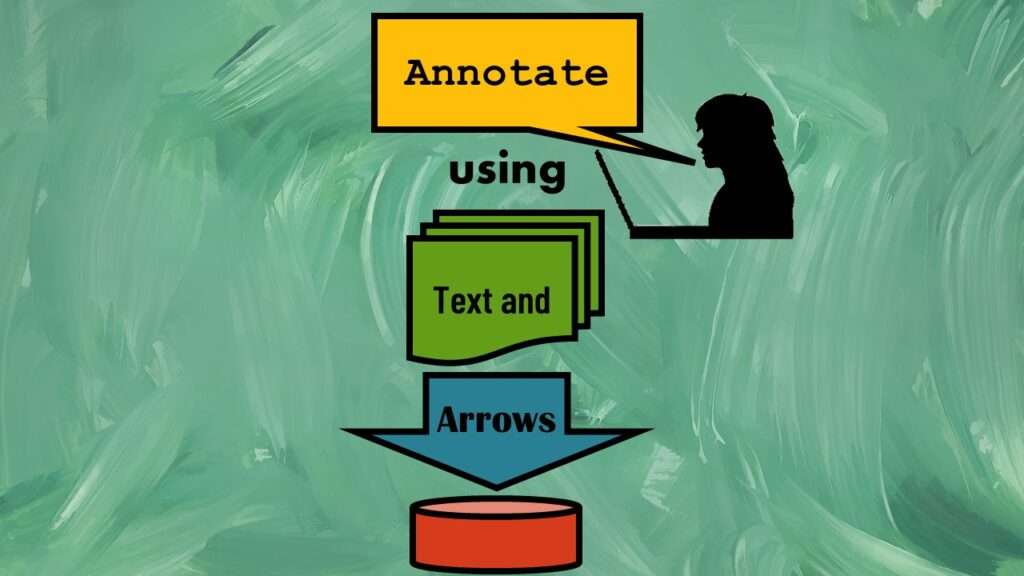
Text and arrows in dataviz, if used wisely, can help your audience understand something very abstract, like a data pipeline. Read my blog post for tips in choosing images for your data visualizations!
17
Aug
Aug
R for logistic regression in health data analytics is a reasonable choice, if you know what packages to use. You don’t have to use SAS! My blog post provides you example R code and a tutorial!

30
Jul
Jul
Connecting SAS to other applications is often necessary, and there are many ways to do it. Read this blog post for a couple of use-cases of SAS data integration using various SAS components.

22
Jun
Jun
“Rapid application development” (RAD) refers to an approach to designing and developing computer applications. In public health and healthcare, we are not taught about application development – but it’s good for us to learn about it, since we have to deal with data from health applications. My blog post talks about the RAD approach I […]
28
Feb
Feb
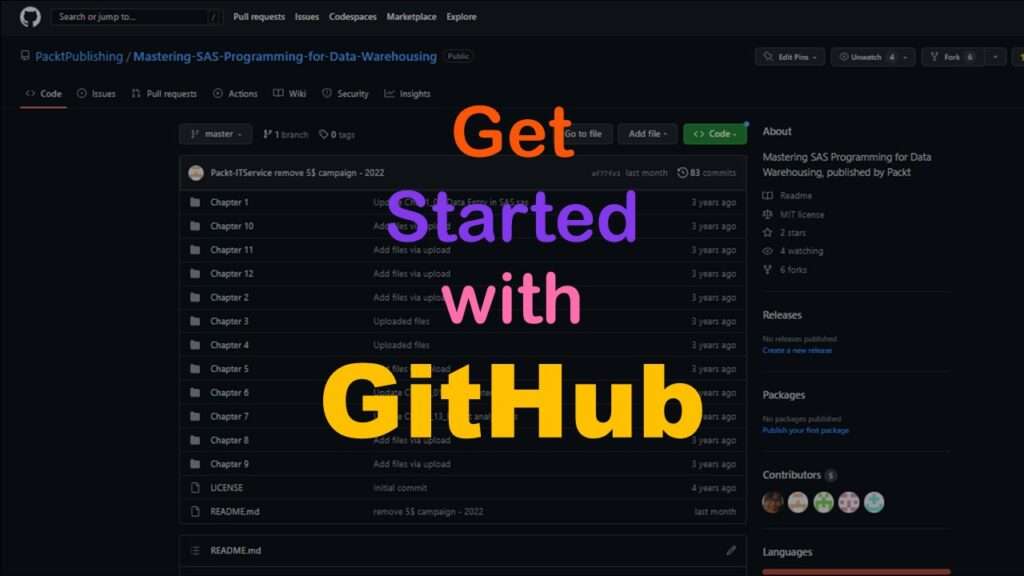
GitHub beginners – even in data science – often feel intimidated when starting their GitHub accounts and trying to interact with the web page. Don’t be shy! Catch the highlights from a recent GitHub beginners workshop I held!