
Confidence intervals (CIs) help you get a solid estimate for the true population measure. Read my blog and try my CI calculator!
Tag Archives: install SAS

30
Jul
Jul
Connecting SAS to other applications is often necessary, and there are many ways to do it. Read this blog post for a couple of use-cases of SAS data integration using various SAS components.

25
Jun
Jun
Project management terminology is often used around epidemiologists, biostatisticians, and health data scientists, and it’s often hard for us to admit we aren’t familiar with some of the terms. Watch my videos and take my Applications Basics course to get up to speed with vocabulary from the health application development domain.

13
Jun
Jun
Reducing query cost is especially important in SAS – but do you know how to do it, or what it even means? Read my blog post to learn why this is important in health data analytics.
31
Mar
Mar
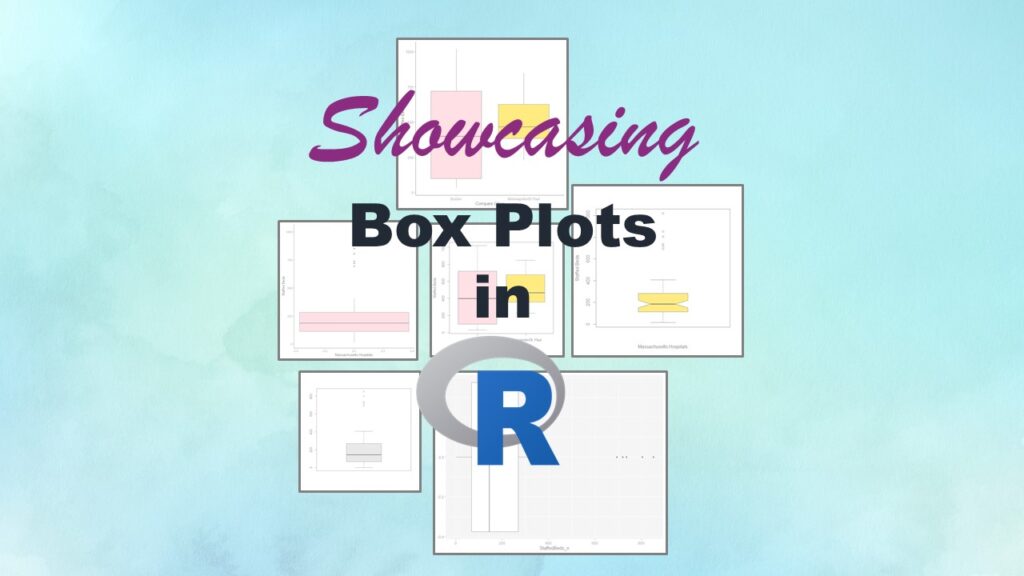
Making box plots in R affords you many different approaches and features. My blog post will show you easy ways to use both base R and ggplot2 to make box plots as you are proceeding with your data science projects.

18
Feb
Feb
GPower case example shows a use-case where we needed to select an outcome measure for our study, then do a power calculation for sample size required under different outcome effect size scenarios. My blog post shows what I did, and how I documented/curated the results.
04
Feb
Feb
Variable names in SAS and R are subject to different “rules and regulations”, and these can be leveraged to your advantage, as I describe in this blog post.
14
Jan
Jan
Counting rows in SAS and R is approached differently, because the two programs process data in different ways. Read my blog post where I describe both ways.