Make categorical variables by cutting up continuous ones. But where to put the boundaries? Get advice on my blog!
Tag Archives: download free software

11
Oct
Oct
Recoloring plots in R? Want to learn how to use an image to inspire R color palettes you can use in ggplot2 plots? Read my blog post to learn how.

11
Oct
Oct
Adding error bars to ggplot2 in R plots is easiest if you include the width of the error bar as a variable in your plot data. Read my blog post to see an example.
20
Apr
Apr
Pie chart ggplot style is surprisingly hard to make, mainly because ggplot2 did not give us a circle shape to deal with. But I explain how to get around it in my blog pot.
25
Mar
Mar
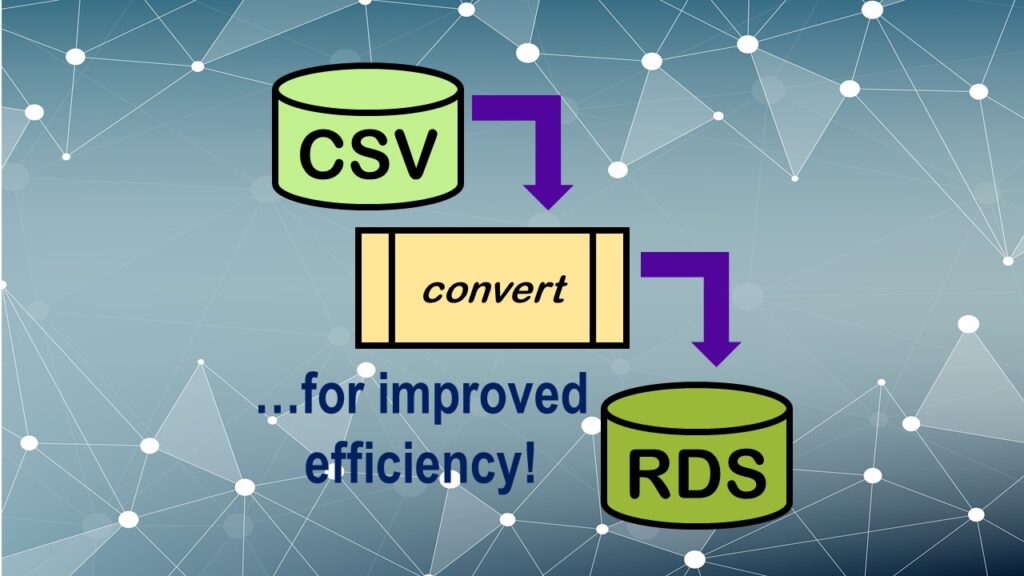
Convert CSV to RDS is what you want to do if you are working with big data files in R GUI and want to improve efficiency. Read my blog post for an explanation and video demonstrations of this process!

18
Feb
Feb
GPower case example shows a use-case where we needed to select an outcome measure for our study, then do a power calculation for sample size required under different outcome effect size scenarios. My blog post shows what I did, and how I documented/curated the results.
28
Jan
Jan
Referring to variables in processing is different conceptually when thinking about SAS compared to R. I explain the differences in my blog post.
07
Jan
Jan
Native formats in SAS and R of data objects have different qualities – and there are reasons behind these differences. Learn about them in this blog post!
26
Dec
Dec
Looking for a SAS-R integration example that uses the best of both worlds? I show you a use-case where I was in a hurry, and did transformation in R with the analysis in SAS!
Public Health Alphabet Soup
Review of Boston University MPH Online Learning Modules for Teaching Graduate Level Public Health Online
10
Mar
Mar
If you are learning epidemiology or refreshing your memory of your formal study of it, you always want to have credible scientific definitions at hand of terms such as “measures of association”. Read my blog post for quick links to Boston University’s online educational module!