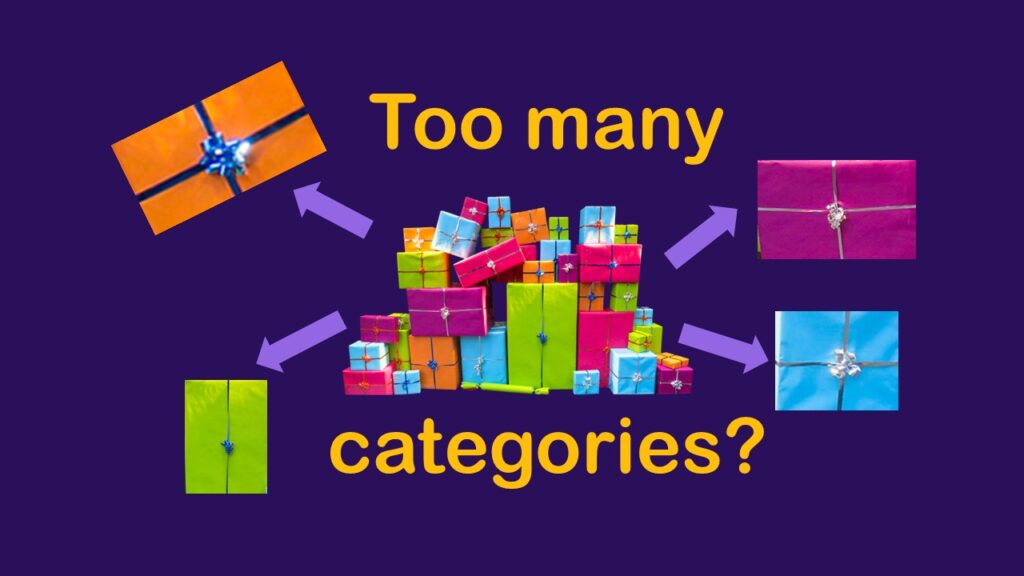
Classification crosswalks are easy to make, and can help you reduce cardinality in categorical variables, making for insightful data science portfolio projects with only descriptive statistics. Read my blog post for guidance!
Tag Archives: deeper learning
17
Oct
Oct
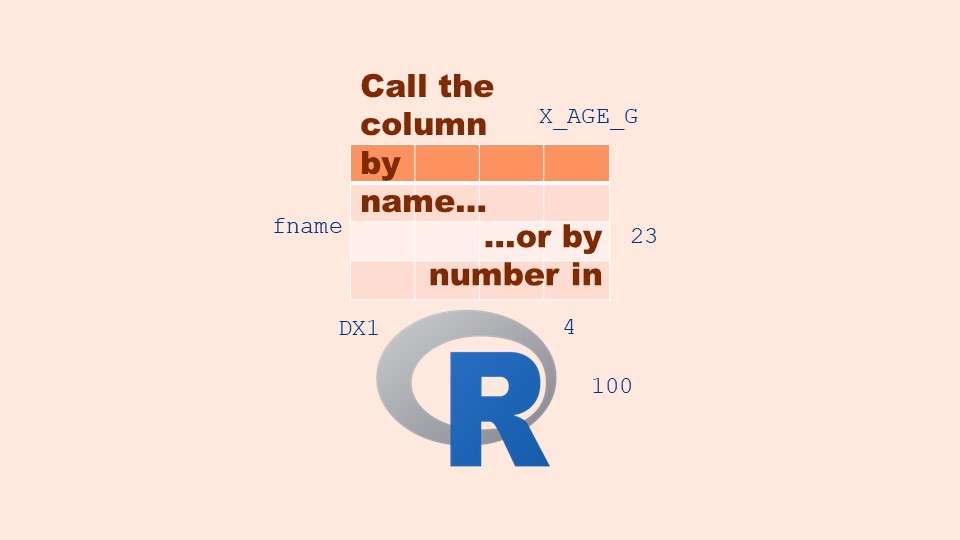
Referring to columns in R can be done using both number and field name syntax. Although field name syntax is easier to use in programming, my blog demonstrates how you can use column numbers to make automation easier.
12
Oct
Oct
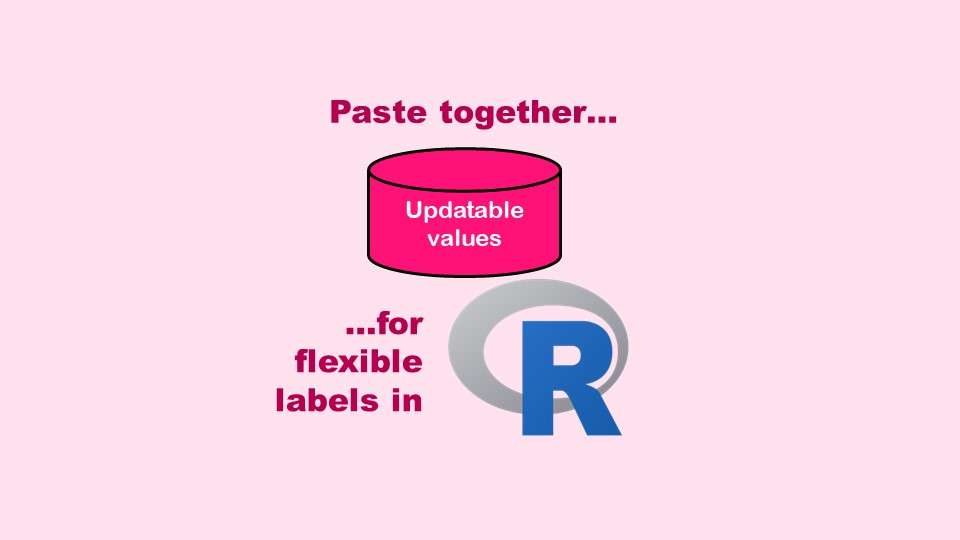
The paste command in R is used to concatenate strings. You can leverage the paste command to make refreshable label objects for reports and plots, as I describe in my blog post.

11
Oct
Oct
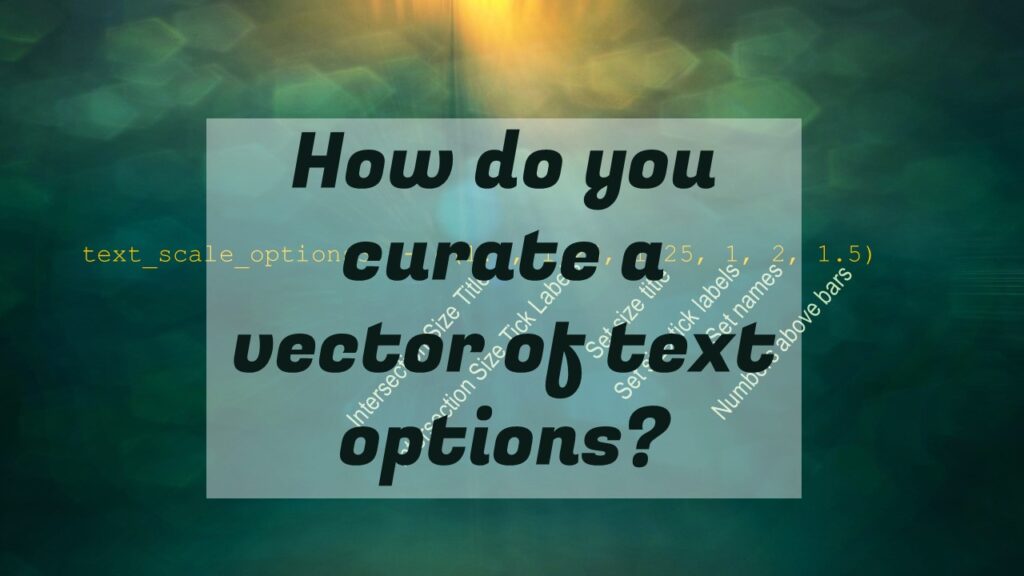
Adding error bars to ggplot2 in R plots is easiest if you include the width of the error bar as a variable in your plot data. Read my blog post to see an example.
21
Apr
Apr
Testimonials for Monika Wahi’s data science courses on LinkedIn Learning are posted here. Read what learners are saying to help you decide if you want to take the courses!
08
Apr
Apr
Data curation solution that I posted recently with my blog post showing how to do upset plots in R using the UpSetR package was itself kind of a masterpiece. Therefore, I thought I’d dedicate this blog post to explaining how and why I did it.
Educational Resources
Need an Online Curriculum in Data Science or Public Health that is Engaging? Here are my Freebies and Hacks!

29
Dec
Dec
Need online curriculum in data science or public health that keeps the learners engaged? I share a links to free resources as well as my hacks to interest high!
21
Jun
Jun
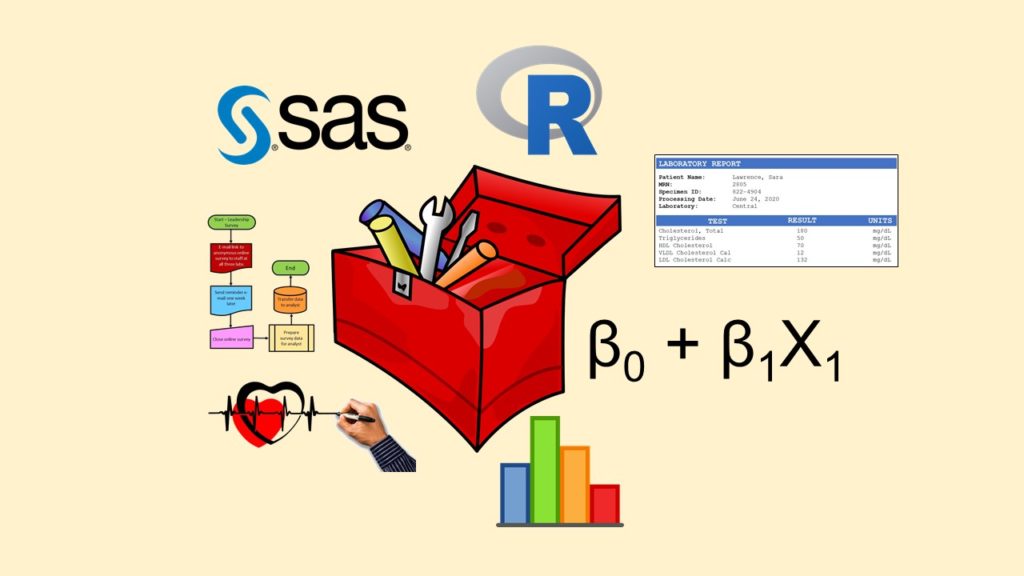
Monika posts her “data science newbie do-it-yourself starter kit”, with links to cheap or free learning resources for the data science newbie who wants to get started in healthcare analytics.
Public Health Alphabet Soup
Review of Boston University MPH Online Learning Modules for Teaching Graduate Level Public Health Online
10
Mar
Mar
If you are learning epidemiology or refreshing your memory of your formal study of it, you always want to have credible scientific definitions at hand of terms such as “measures of association”. Read my blog post for quick links to Boston University’s online educational module!
Career Development
Physical College Classrooms are so Yesterday. Why Are We Still Studying Deeper Learning in Face-to-Face Settings?

17
Feb
Feb
My colleague who is a professor at Fitchburg State University studies deeper learning in face-to-face and online approaches in higher education. The idea is that if educators use deeper learning approaches, the students will learn more efficiently. Others have talked to me about deeper learning, and when I looked into it, I found that the […]