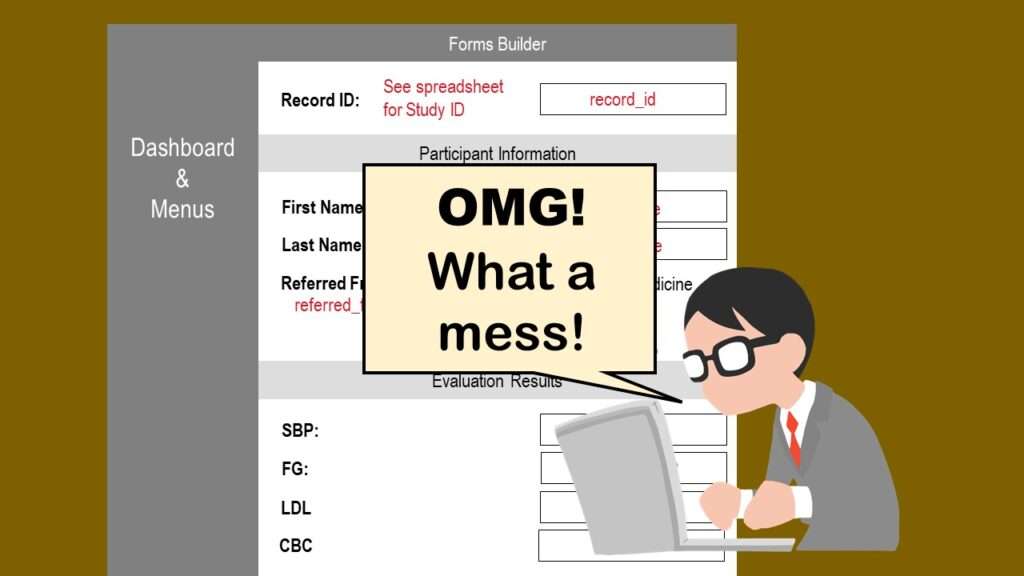
REDCap mess happens often in research shops, and it’s an analysis showstopper! Read my blog post to learn my secret tricks for breaking through the barriers and getting on with data analytics!
Tag Archives: data documentation
28
Feb
Feb
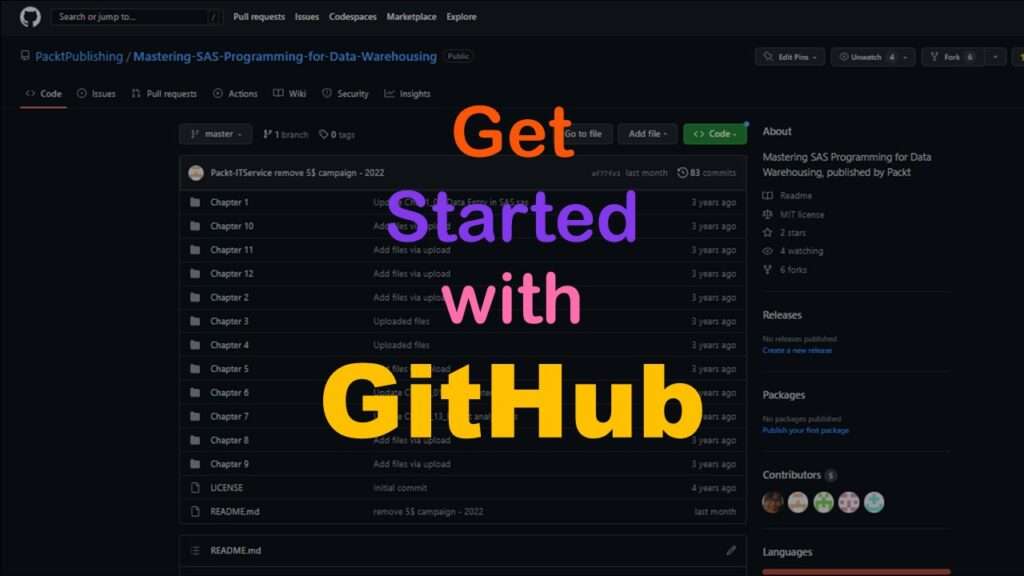
GitHub beginners – even in data science – often feel intimidated when starting their GitHub accounts and trying to interact with the web page. Don’t be shy! Catch the highlights from a recent GitHub beginners workshop I held!

11
Oct
Oct
Recoloring plots in R? Want to learn how to use an image to inspire R color palettes you can use in ggplot2 plots? Read my blog post to learn how.

08
Apr
Apr
Data curation solution that I posted recently with my blog post showing how to do upset plots in R using the UpSetR package was itself kind of a masterpiece. Therefore, I thought I’d dedicate this blog post to explaining how and why I did it.
16
Feb
Feb
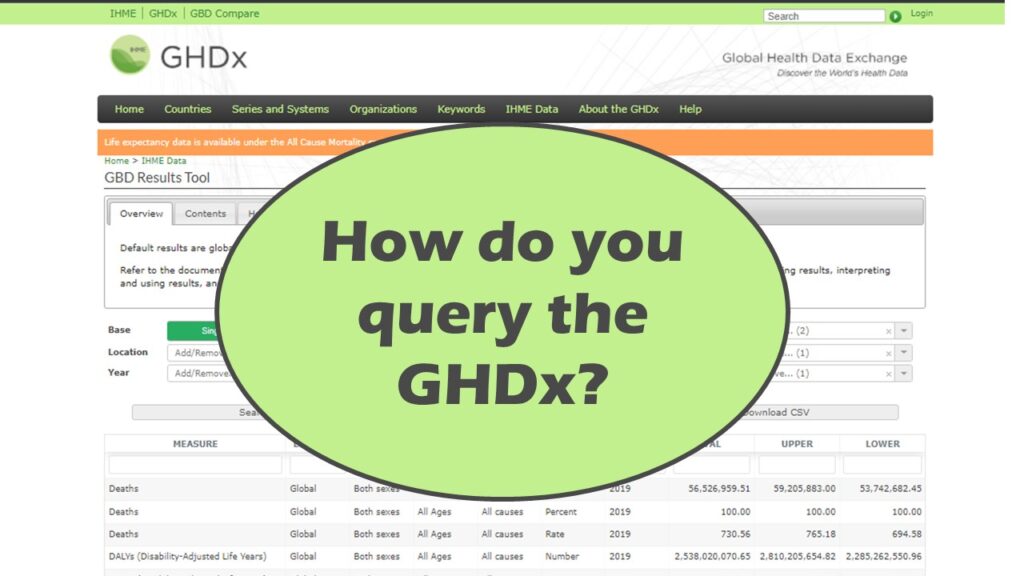
Querying the GHDx database is challenging because of its difficult user interface, but mastering it will allow you to access country-level health data for comparisons! See my demonstration!
20
Jan
Jan
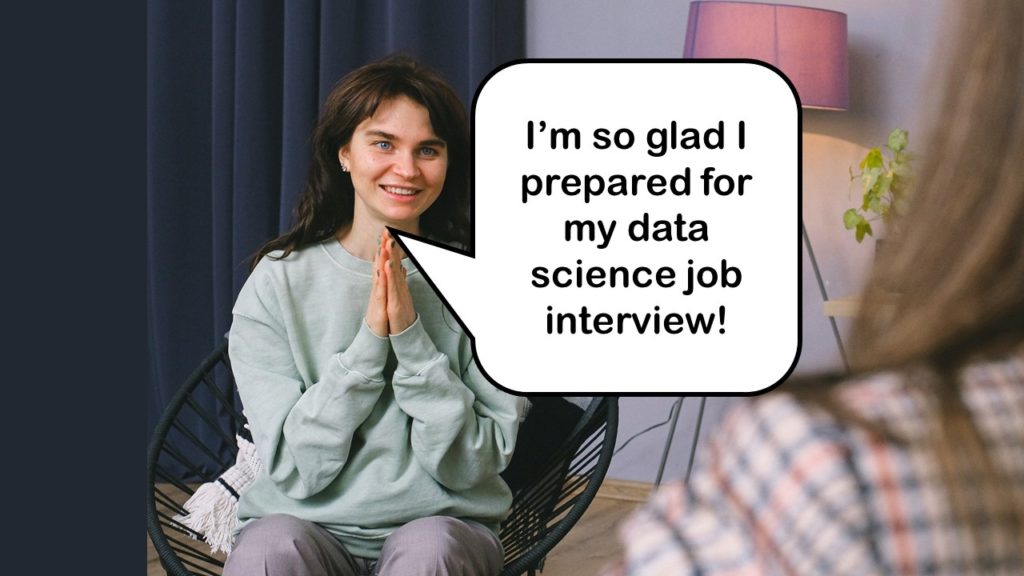
Interview preparation for data science jobs can involve taking several simple, actionable steps to make yourself feel confident and ready to answer questions with ease. Read my blog post for my tips and tricks!

06
Jan
Jan
Paid mentoring for data science can be worth the cost in certain circumstances – but not others. My blog post provides guidance on hiring a paid mentor.
26
Dec
Dec
Looking for a SAS-R integration example that uses the best of both worlds? I show you a use-case where I was in a hurry, and did transformation in R with the analysis in SAS!
26
Nov
Nov
Get to know three of my favorite SAS documentation pages: the one with sort order, the one that lists all the SAS formats, and the one that explains all the SAS operators and expressions!
19
Oct
Oct
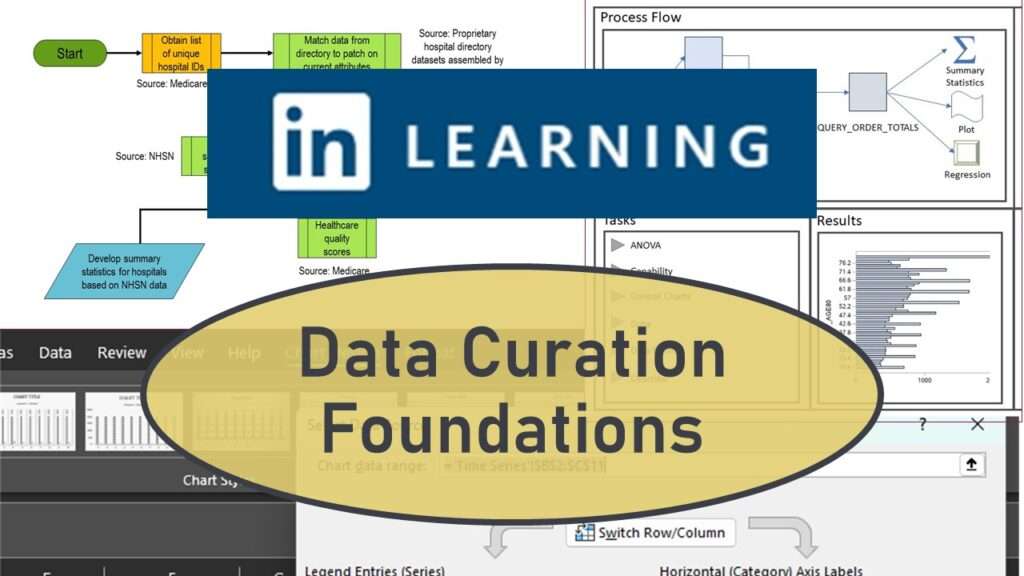
Curation files are especially helpful for communicating about data on teams. Learn more about what you’ll learn when you take my online LinkedIn Learning data curation course!
- 1
- 2