Tag Archives: data cleaning

Portfolio Project Examples for Independent Data Science Projects

Are you a data scientist who is interested in doing independent portfolio projects to sharpen your skills? Then I strongly suggest you get a coach or a mentor.

Portfolio project examples are sometimes needed for newbies in data science who are looking to complete independent projects. This blog post provides some great examples of independent projects you can do with datasets available online!

Convert CSV to RDS When Using R for Easier Data Handling

If you want to use R for a project and the source CSV is very big, it can improve input/output efficiency to convert the file to an RDS.

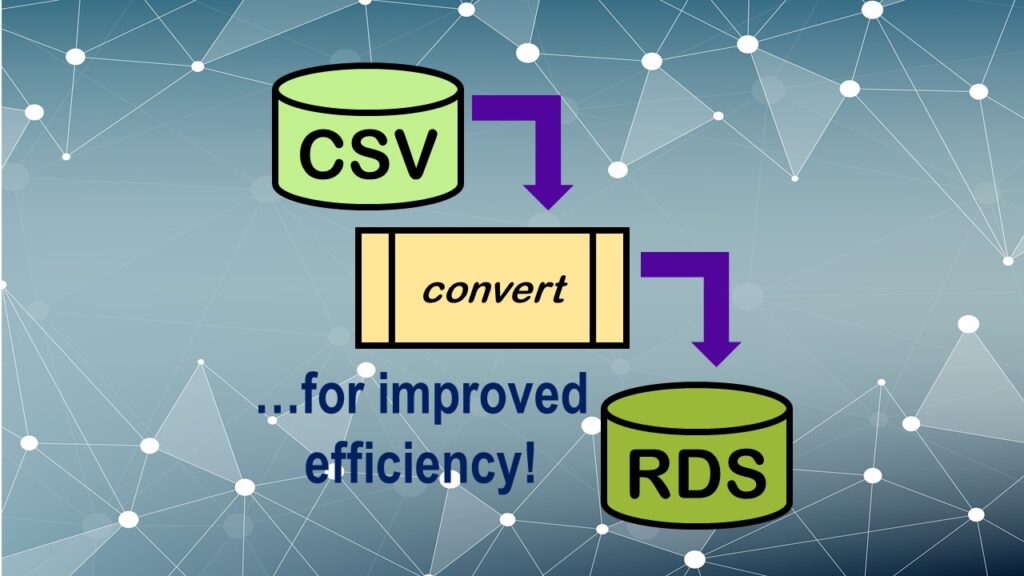
Convert CSV to RDS is what you want to do if you are working with big data files in R GUI and want to improve efficiency. Read my blog post for an explanation and video demonstrations of this process!

Native Formats in SAS and R for Data Are Different: Here’s How!

Why use particular data formats for different programming languages in statistics? Because the programs can then process the data faster and with more accuracy.

Native formats in SAS and R of data objects have different qualities – and there are reasons behind these differences. Learn about them in this blog post!

Paid Mentoring for Data Science: Is it Worth the Cost?

If you are wondering if you should set up a paid mentoring relationship with a data science mentor, you definitely want to read this. You want to make sure you get your money's worth.

Paid mentoring for data science can be worth the cost in certain circumstances – but not others. My blog post provides guidance on hiring a paid mentor.

SAS-R Integration Example: Transform in R, Analyze in SAS!

You can use SAS and R together in one project. I show you how to develop an analytic dataset in R and put it in SAS ODA for analysis.

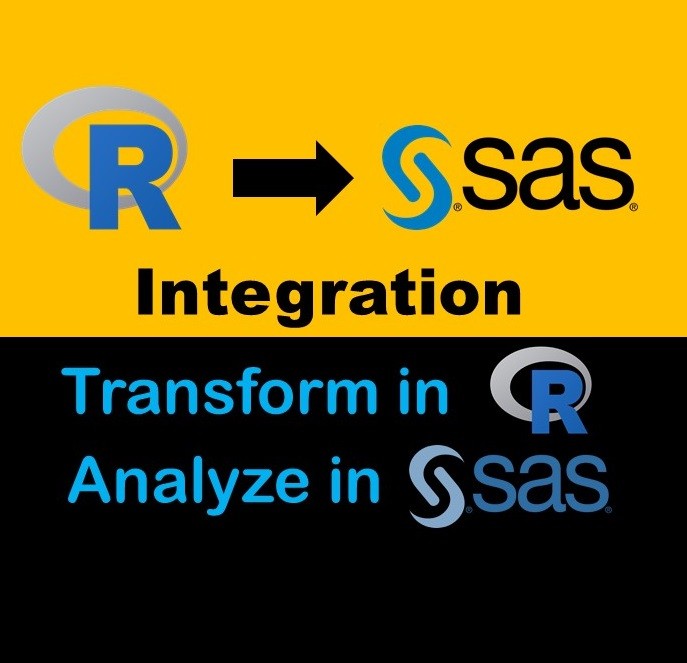
Looking for a SAS-R integration example that uses the best of both worlds? I show you a use-case where I was in a hurry, and did transformation in R with the analysis in SAS!

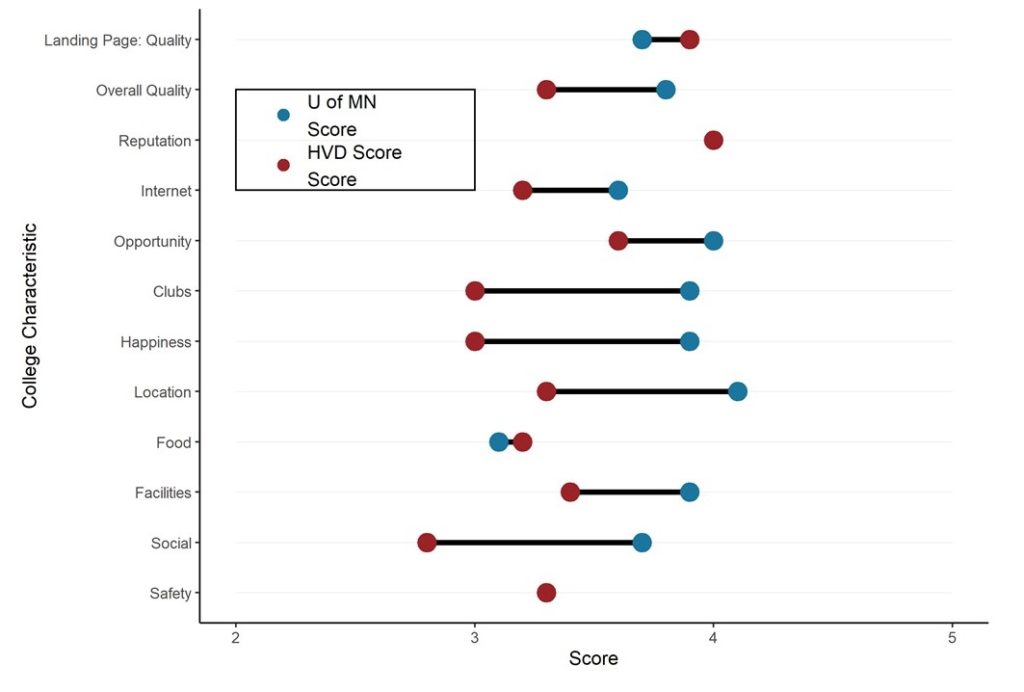
Dumbbell Plot for Comparison of Rated Items: Which is Rated More Highly – Harvard or the U of MN?

This is an example of a dumbbell plot from the ggalt package in R that you can also use in RStudio

Want to compare multiple rankings on two competing items – like hotels, restaurants, or colleges? I show you an example of using a dumbbell plot for comparison in R with the ggalt package for this exact use-case!

Data Science of Data Collection: Free Course and Course Series!

“Understanding Research Forms, Surveys and Instruments” is a 6-course online tutorial series aimed at graduate students and new researchers so they learn how to collect data properly, and do not make mistakes that can cost them their degree or job promotion!

Learn the “data science of data collection” through my free introductory course! If you want to learn more, continue with the whole six-course series. Great for graduate students and QA/QI professionals!

Verified by MonsterInsights