Tag Archives: academic coaching

May
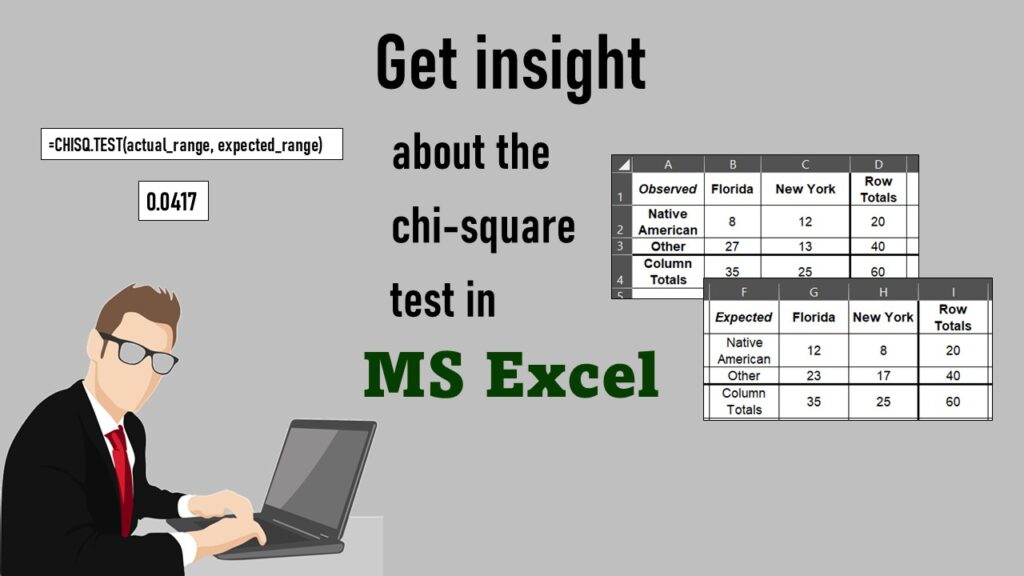
Chi-square test is hard to grasp – but doing it in Microsoft Excel can give you special insight. Read about it on my blog!
May
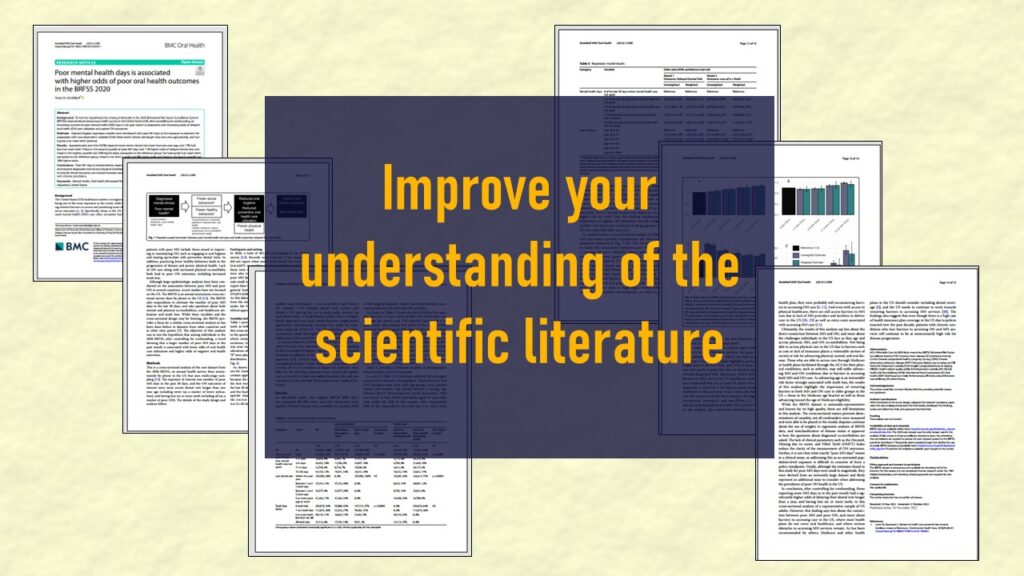
Identify elements in research reports, and you’ll be able to understand them much more easily. My blog post shows you how!
Apr
DPS Update: I’m doing better and working again! Check out my updated LinkedIn Learning courses and books for sale!
Data Science
CDC Wonder for Studying Vaccine Adverse Events: The Shameful State of US Open Government Data

Jun
CDC Wonder is an online query portal that serves as a gateway to many government datasets. Although antiquated, it still works for extracting data, and my blog post shows you how.
Nov
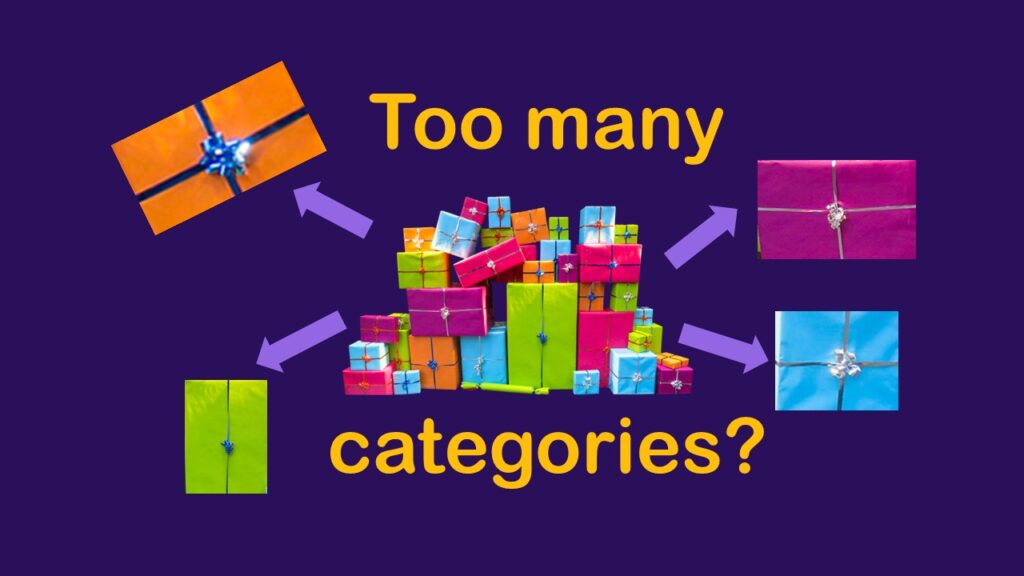
Classification crosswalks are easy to make, and can help you reduce cardinality in categorical variables, making for insightful data science portfolio projects with only descriptive statistics. Read my blog post for guidance!
Oct
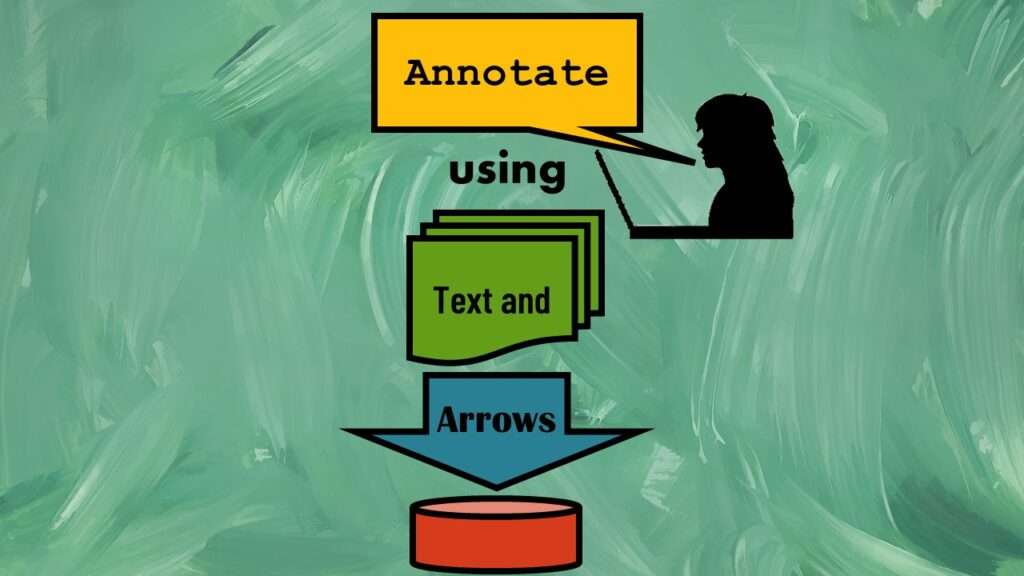
Text and arrows in dataviz, if used wisely, can help your audience understand something very abstract, like a data pipeline. Read my blog post for tips in choosing images for your data visualizations!
Jul
Connecting SAS to other applications is often necessary, and there are many ways to do it. Read this blog post for a couple of use-cases of SAS data integration using various SAS components.

Jul
Portfolio project examples are sometimes needed for newbies in data science who are looking to complete independent projects. This blog post provides some great examples of independent projects you can do with datasets available online!

Mar
Management tips for data scientists can be used by anyone – at work and in your personal life! Get the details in my blog post.