AI careers are not easy to navigate. Read my blog post for foolproof advice for those interested in building a career in AI.
Tag Archives: business transparency
24
Aug
Aug
Table editing in R is easier than in SAS, because you can refer to columns, rows, and individual cells in the same way you do in MS Excel. Read my blog post for example R table editing code.
17
Aug
Aug
R for logistic regression in health data analytics is a reasonable choice, if you know what packages to use. You don’t have to use SAS! My blog post provides you example R code and a tutorial!
21
Mar
Mar
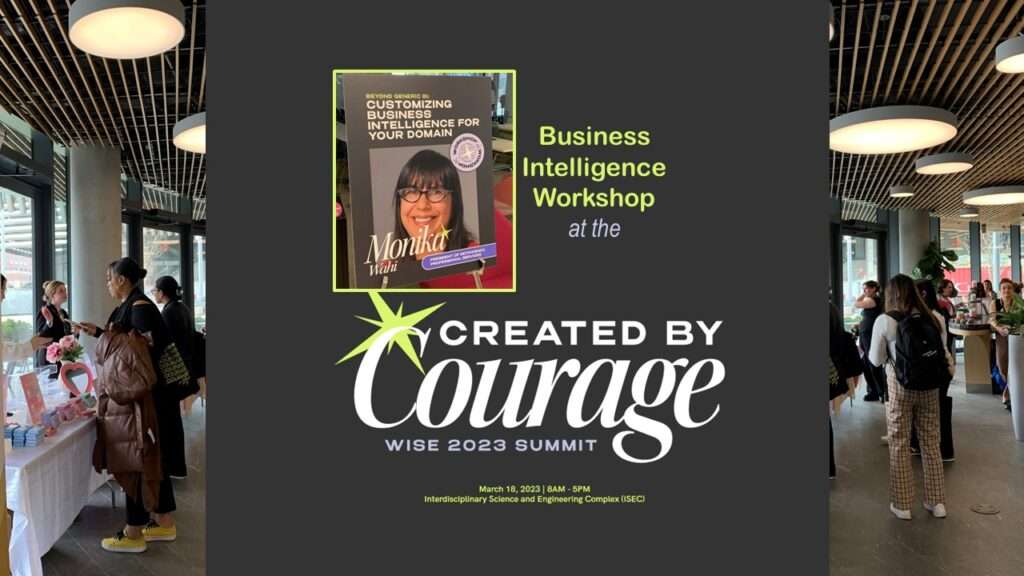
WISE Summit 2023 at Northeastern University was the biggest and best one so far! I was honored to lead a business intelligence workshop, as I talk about in my blog post.
07
Mar
Mar
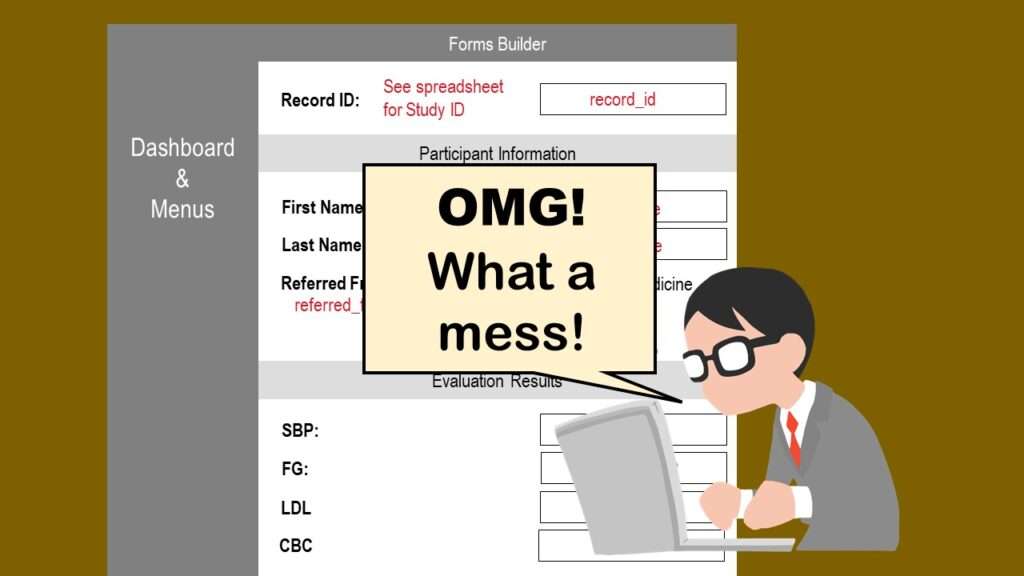
REDCap mess happens often in research shops, and it’s an analysis showstopper! Read my blog post to learn my secret tricks for breaking through the barriers and getting on with data analytics!
25
Nov
Nov
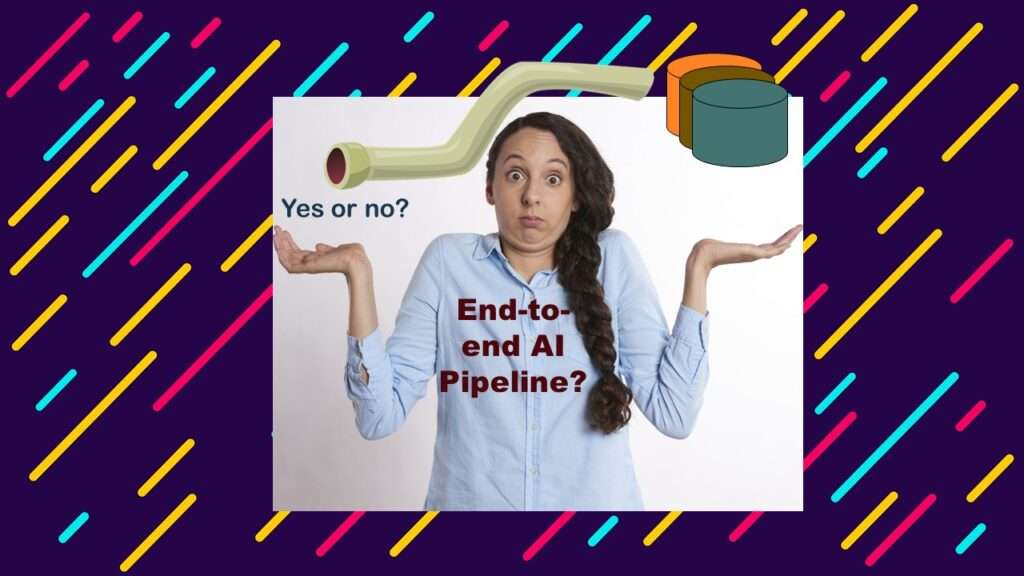
End-to-end AI pipelines are being created routinely in industry, and one complaint is that academics can only contribute to one component of the pipeline. Really? Read my blog post for an alternative viewpoint!
06
Jun
Jun
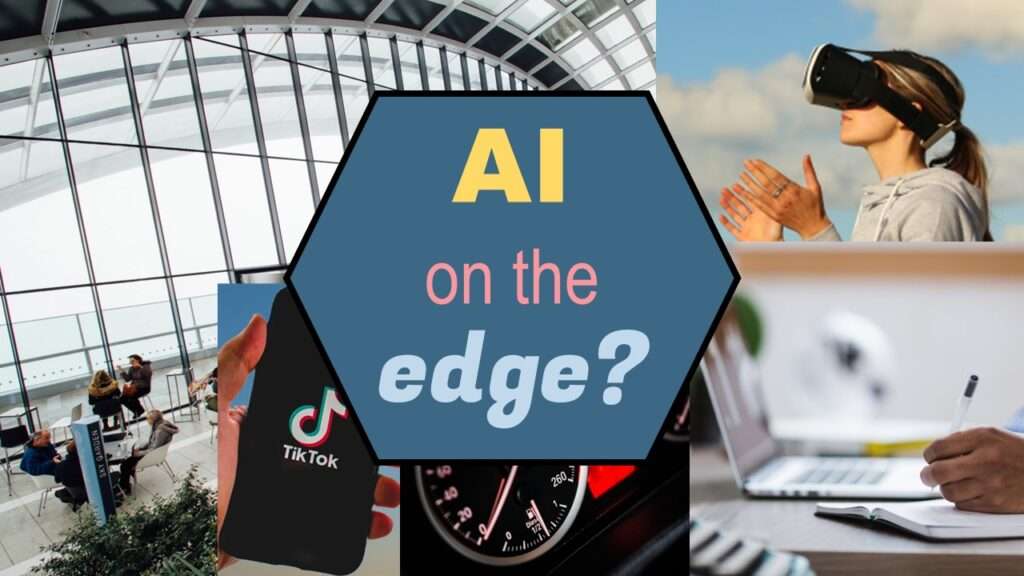
“AI on the edge” was a new term for me that I learned from Marc Staimer, founder of Dragon Slayer Consulting, who was interviewed in a podcast. Marc explained how AI on the edge poses a data storage problem, and my blog post proposes a solution!
15
Dec
Dec
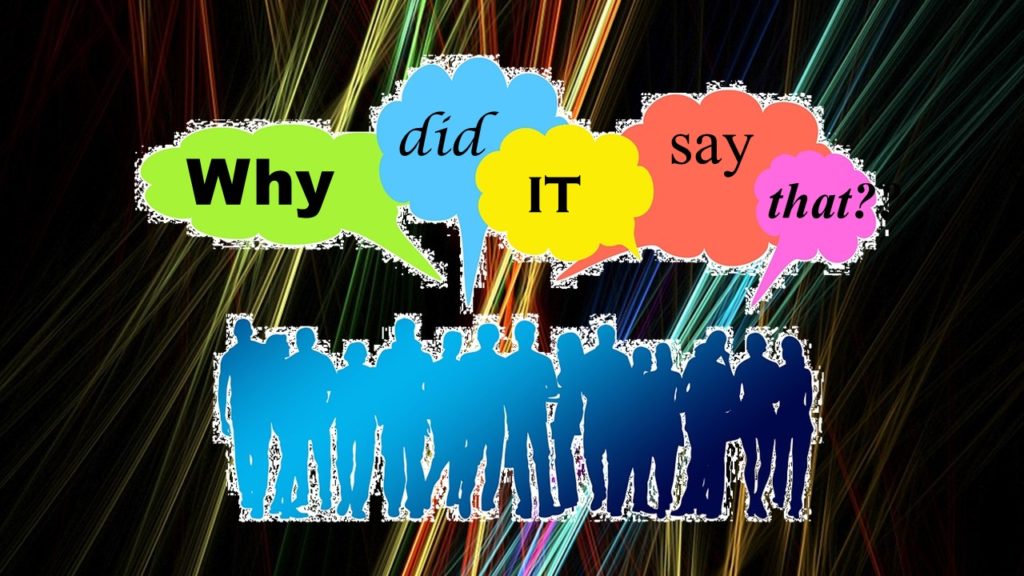
We experience artificial intelligence all the time on the internet in terms of friend suggestions on social media, internet ads that reflect what we have been searching for, and “smart” recommendations from online stores. But the reality is that even the people who build those formulas cannot usually explain why you were shown a certain […]