Tag Archives: Advanced Practice Registered Nurse

Dataset Source Documentation: Necessary for Data Science Projects with Multiple Data Sources

If you work on a big data project with multiple source datasets, you run the risk of forgetting exactly how you blended them together.

Dataset source documentation is good to keep when you are doing an analysis with data from multiple datasets. Read my blog to learn how easy it is to throw together some quick dataset source documentation in PowerPoint so that you don’t forget what you did.

Joins in Base R: Alternative to SQL-like dplyr

In base R, you can execute SQL-like joins, as long as you use the correct code syntax.

Joins in base R must be executed properly or you will lose data. Read my tutorial on how to correctly execute left joins in base R.

Defaults in PowerPoint: Setting Them Up for Data Visualizations

The defaults in PowerPoint are really set up for making presentations, not data visualizations.

Defaults in PowerPoint are set up for slides – not data visualizations. Read my blog post for tips on reconfiguring PowerPoint to make it easy for dataviz!

Data Science Services: Which Level Is Right for You?

If you want to learn about data science online, then you want to check out all of our online learning resources, such as YouTube videos and tutorials.

Data science services online in the comfort of your own home? That’s our specialty! We give you online educational events, learning resources, courses, coaching and more!

R for Logistic Regression: Example from Epidemiology and Biostatistics

Logistic regression calculate the log odds of the probability of the outcome. Many people are used to using SAS for logistic regression, but you can also use R.

R for logistic regression in health data analytics is a reasonable choice, if you know what packages to use. You don’t have to use SAS! My blog post provides you example R code and a tutorial!

Rapid Application Development Public Health Style

If you work on front-ends or back-ends of health applications, you are probably already familiar with the concepts of Agile and rapid application development.

“Rapid application development” (RAD) refers to an approach to designing and developing computer applications. In public health and healthcare, we are not taught about application development – but it’s good for us to learn about it, since we have to deal with data from health applications. My blog post talks about the RAD approach I […]

Applications Basics for Data Analysts and Statisticians

Many people trained in healthcare and public health do not know much about applications.

Applications basics are now essential knowledge if you want to do data science in healthcare. Get a crash course in applications basics!

Rebrand as a Data Scientist: Online Mentoring Program

Want to apply your domain knowledge to the field of data science? Join our mentoring program!

Learn about our online data science group mentoring program, and find out if it is right for you!

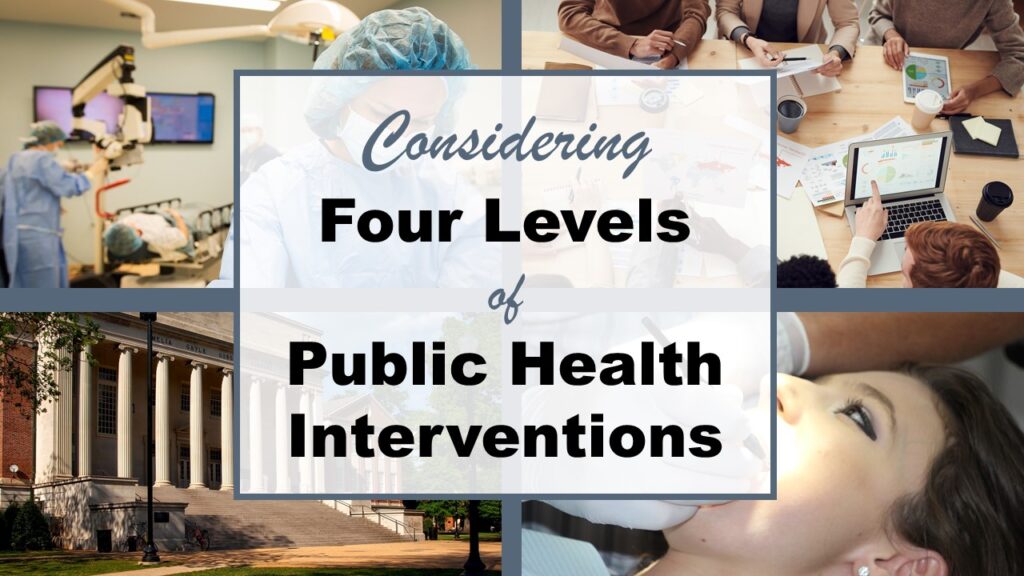
Four Levels of Intervention for Public Health: How to Apply This Framework

Four levels of public health interventions should be addressed when dealing with public health problems.

Four levels of intervention is a framework we use in public health to think about how to attack a problem. I explain it and give a few examples of application in my blog post (along with a video).

Pie Chart ggplot Style is Surprisingly Hard! Here’s How I Did it

How do you make a pie chart in ggplot2 package in R? It's not that obvious

Pie chart ggplot style is surprisingly hard to make, mainly because ggplot2 did not give us a circle shape to deal with. But I explain how to get around it in my blog pot.

Verified by MonsterInsights