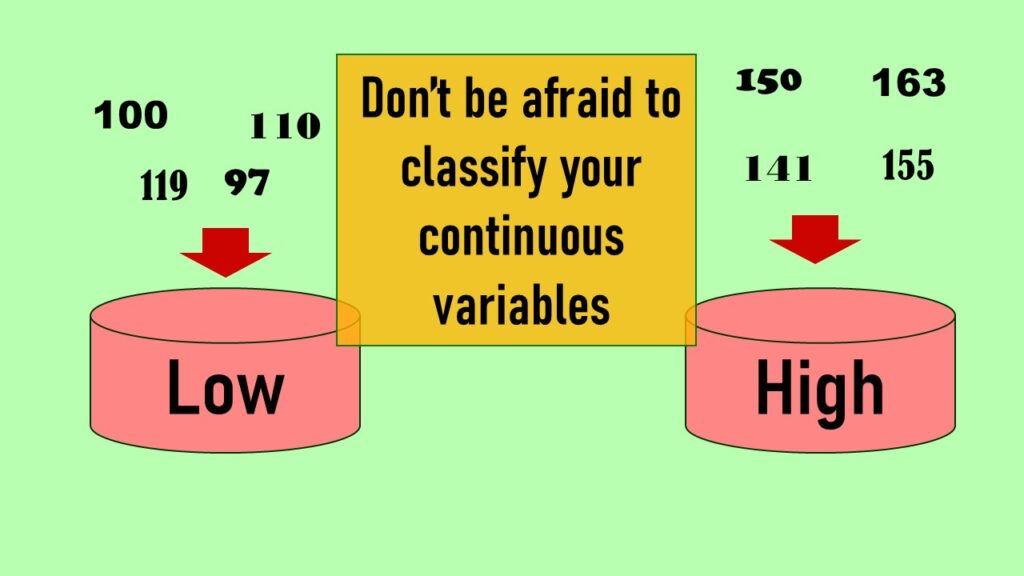
Continuous variable categorized can open up a world of possibilities for analysis. Read about it on my blog!
Tag Archives: box-and-whisker plots

28
Oct
Oct
Remove rows by criteria is a common ETL operation – and my blog post shows you how to do it using the subset command.

07
Nov
Nov
Joins in base R must be executed properly or you will lose data. Read my tutorial on how to correctly execute left joins in base R.

11
Apr
Apr
Time series plots in R are totally customizable using the ggplot2 package, and can come out with a look that is clean and sharp. However, you usually end up fighting with formatting the x-axis and other options, and I explain in my blog post.
31
Mar
Mar
Making box plots in R affords you many different approaches and features. My blog post will show you easy ways to use both base R and ggplot2 to make box plots as you are proceeding with your data science projects.