R for logistic regression in health data analytics is a reasonable choice, if you know what packages to use. You don’t have to use SAS! My blog post provides you example R code and a tutorial!
Tag Archives: R packages

03
Apr
Apr
Making upset plots with R package UpSetR is an easy way to visualize patterns of attributes in your data. My blog post demonstrates making patterns of co-morbidities in health survey respondents from the BRFSS, and walks you through setting text and color options in the code.
11
Oct
Oct
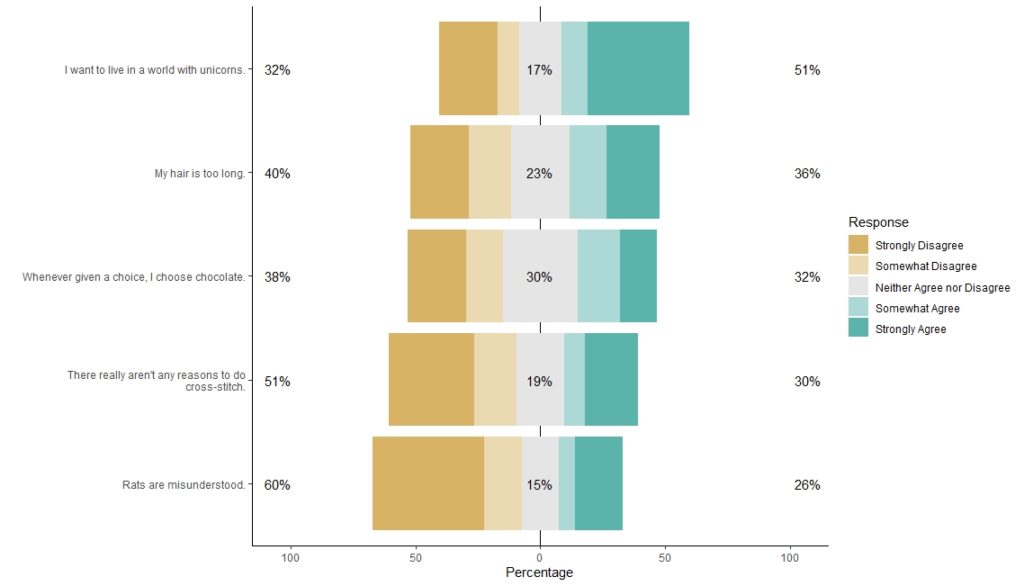
I love the Likert package in R, and use it often to visualize data. The problem is that sometimes, I have sparse data, and this can cause problems with the package. This blog post shows you a workaround, and also, a way to format the final plot that I think looks really great!