Tag Archives: peer-reviewed literature

Remove Rows in R with the Subset Command

Learn r programming and biostatistics

Remove rows by criteria is a common ETL operation – and my blog post shows you how to do it using the subset command.

Joins in Base R: Alternative to SQL-like dplyr

In base R, you can execute SQL-like joins, as long as you use the correct code syntax.

Joins in base R must be executed properly or you will lose data. Read my tutorial on how to correctly execute left joins in base R.

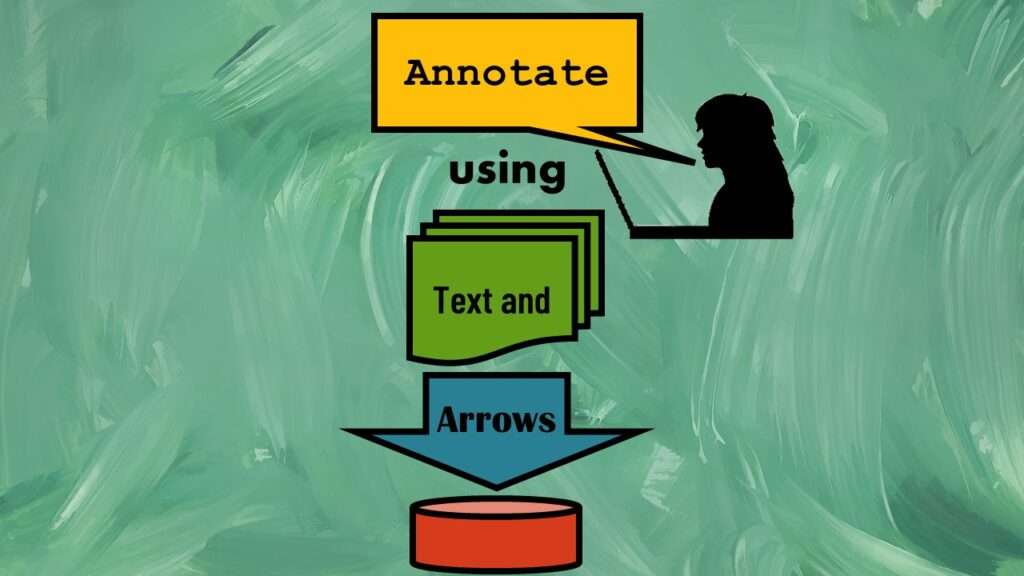
Text and Arrows in Dataviz Can Greatly Improve Understanding

Adding text and arrows to diagrams can help your audience navigate the image, and understand what you are trying to communicate.

Text and arrows in dataviz, if used wisely, can help your audience understand something very abstract, like a data pipeline. Read my blog post for tips in choosing images for your data visualizations!

Ask Me Anything About Data Science or Public Health!

If you want expert consultation every month from a professor, leader, and data scientist, then we have the perfect service for you.

Ask me anything about data science or public health every month! Subscribe to my “Ask Me Anything” membership, and get all your questions answered in real time!

Wiley’s Predatory Behavior: My Recent Experience and Recommendations

Predatory publishers of scientific journals engage in unethical behavior, so you should steer clear of them. Until now, I had thought Wiley did not behave like them. But a recent incident made me change my mind.

Wiley’s predatory behavior recently with a colleague’s scientific manuscript makes me want to avoid publishing in their journals. Read about our experience.

The Paste Command in R is Great for Labels on Plots and Reports

The paste command is used to concatenate strings in R. You can use it different ways, which is what I demonstrate in my blog and videos.

The paste command in R is used to concatenate strings. You can leverage the paste command to make refreshable label objects for reports and plots, as I describe in my blog post.

US Public Health Alphabet Soup Explained: What is the ONC?

Before the ONC office was established in 2009, there was no federal oversight of medical record systems.

“What is the ONC?” is what I used to ask before I realized it involves health technology. Although ONC just means “Office of the National Coordinator”, this agency is now known as HealthIT.gov, as I explain in my blog post.

Time Series Plots in R Using ggplot2 Are Ultimately Customizable

Time series plots can be customized if you use package ggplot2 in R. You can place labels and configure axes.

Time series plots in R are totally customizable using the ggplot2 package, and can come out with a look that is clean and sharp. However, you usually end up fighting with formatting the x-axis and other options, and I explain in my blog post.

Native Formats in SAS and R for Data Are Different: Here’s How!

Why use particular data formats for different programming languages in statistics? Because the programs can then process the data faster and with more accuracy.

Native formats in SAS and R of data objects have different qualities – and there are reasons behind these differences. Learn about them in this blog post!

Verified by MonsterInsights