

Problems with PRISMA? You’re not the only one. The PRISMA framework does not work well for most reviews. Read my blog post to learn what you should do instead.
Tag Archives: peer-reviewed research
02
Oct
Oct
Mixed methods research is trending now, with doctoral students and academics being pressured to do it. But is it always the right approach? Read my blog and find out!
04
Oct
Oct
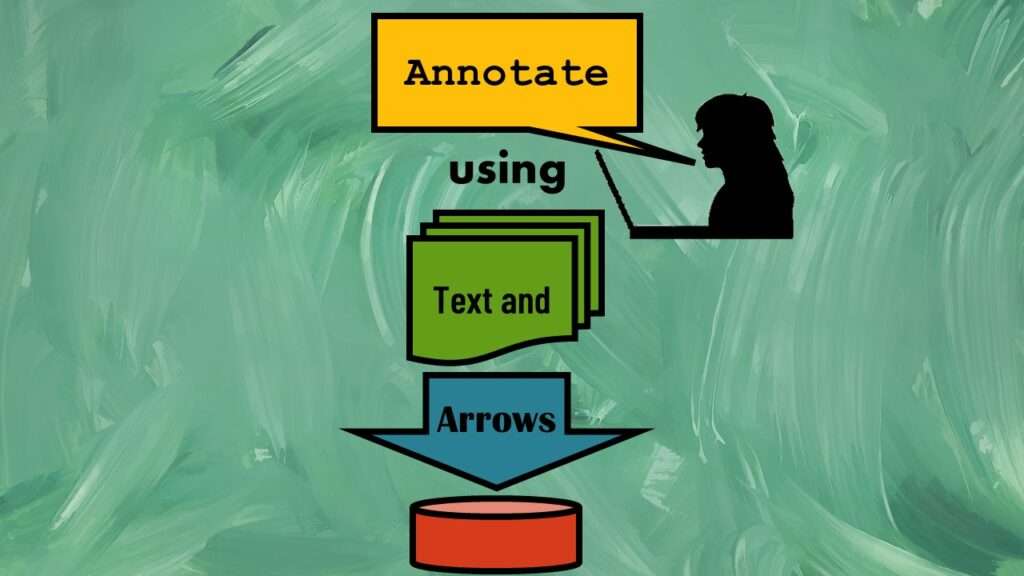
Text and arrows in dataviz, if used wisely, can help your audience understand something very abstract, like a data pipeline. Read my blog post for tips in choosing images for your data visualizations!

30
Sep
Sep
Ask me anything about data science or public health every month! Subscribe to my “Ask Me Anything” membership, and get all your questions answered in real time!

13
Jul
Jul
Portfolio project examples are sometimes needed for newbies in data science who are looking to complete independent projects. This blog post provides some great examples of independent projects you can do with datasets available online!

22
Nov
Nov
Wiley’s predatory behavior recently with a colleague’s scientific manuscript makes me want to avoid publishing in their journals. Read about our experience.
17
Oct
Oct
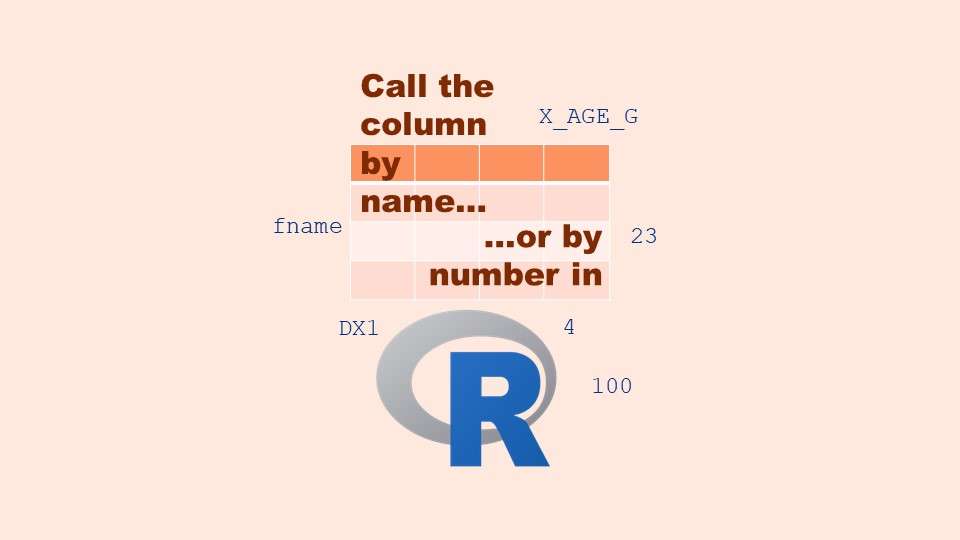
Referring to columns in R can be done using both number and field name syntax. Although field name syntax is easier to use in programming, my blog demonstrates how you can use column numbers to make automation easier.
12
Oct
Oct
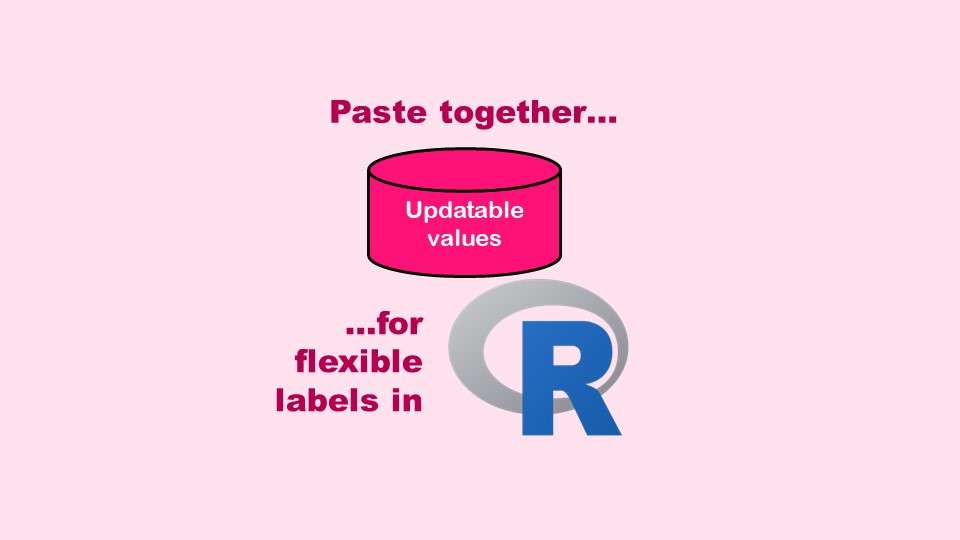
The paste command in R is used to concatenate strings. You can leverage the paste command to make refreshable label objects for reports and plots, as I describe in my blog post.
11
Apr
Apr
Time series plots in R are totally customizable using the ggplot2 package, and can come out with a look that is clean and sharp. However, you usually end up fighting with formatting the x-axis and other options, and I explain in my blog post.

03
Apr
Apr
Making upset plots with R package UpSetR is an easy way to visualize patterns of attributes in your data. My blog post demonstrates making patterns of co-morbidities in health survey respondents from the BRFSS, and walks you through setting text and color options in the code.