
What is the VA – which stands for Veterans Affairs? This United States federal agency is tasked with ensuring veterans receive their benefits – especially health benefits. Unfortunately, as my blog post explains, the VA is facing a myriad of challenges today, including funding problems as well as corruption.
Author Archives: Monika Wahi

11
Apr
Apr
Time series plots in R are totally customizable using the ggplot2 package, and can come out with a look that is clean and sharp. However, you usually end up fighting with formatting the x-axis and other options, and I explain in my blog post.
09
Apr
Apr
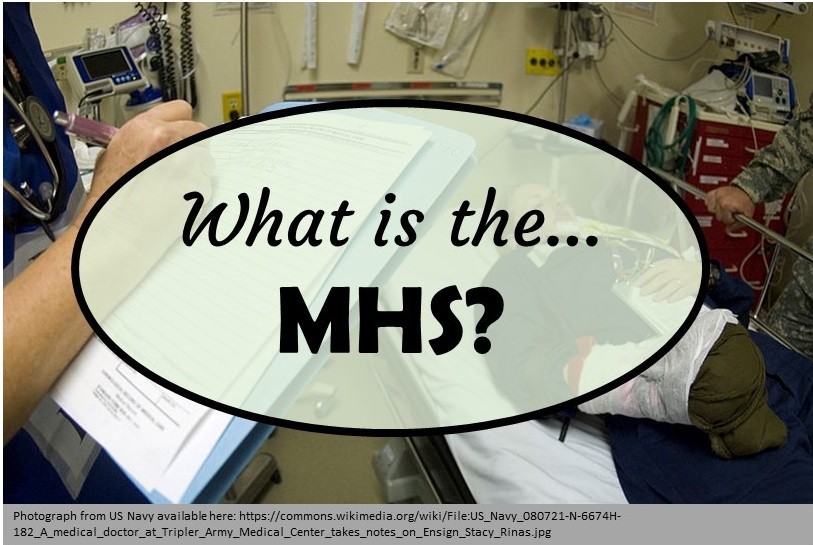
“What is the MHS?” is a question not always asked by public health data scientists, but it should be. The MHS – or Military Health System – serves the US military through healthcare facilities in locations where civilians do not have access. I provide an explanation on my blog post.

08
Apr
Apr
Data curation solution that I posted recently with my blog post showing how to do upset plots in R using the UpSetR package was itself kind of a masterpiece. Therefore, I thought I’d dedicate this blog post to explaining how and why I did it.

07
Apr
Apr
“What is the HRSA?” can be answered two ways: with a short answer, and a long answer. The short answer is that it is the agency that funds public health departments in the United States. The long answer, which I unpack in my blog post, is more nuanced, harrowing, and ultimately, depressing.

03
Apr
Apr
Making upset plots with R package UpSetR is an easy way to visualize patterns of attributes in your data. My blog post demonstrates making patterns of co-morbidities in health survey respondents from the BRFSS, and walks you through setting text and color options in the code.
31
Mar
Mar
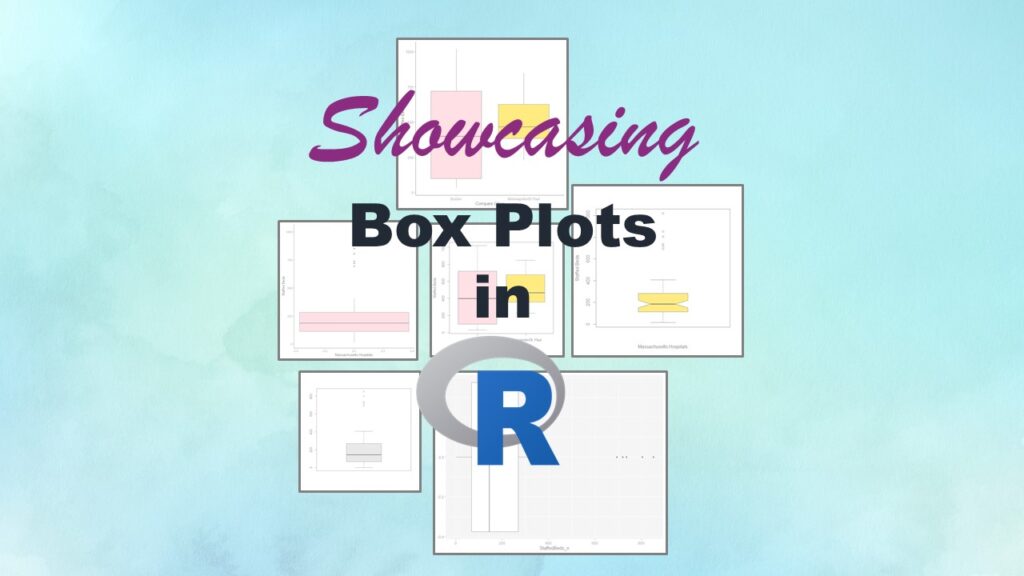
Making box plots in R affords you many different approaches and features. My blog post will show you easy ways to use both base R and ggplot2 to make box plots as you are proceeding with your data science projects.
25
Mar
Mar
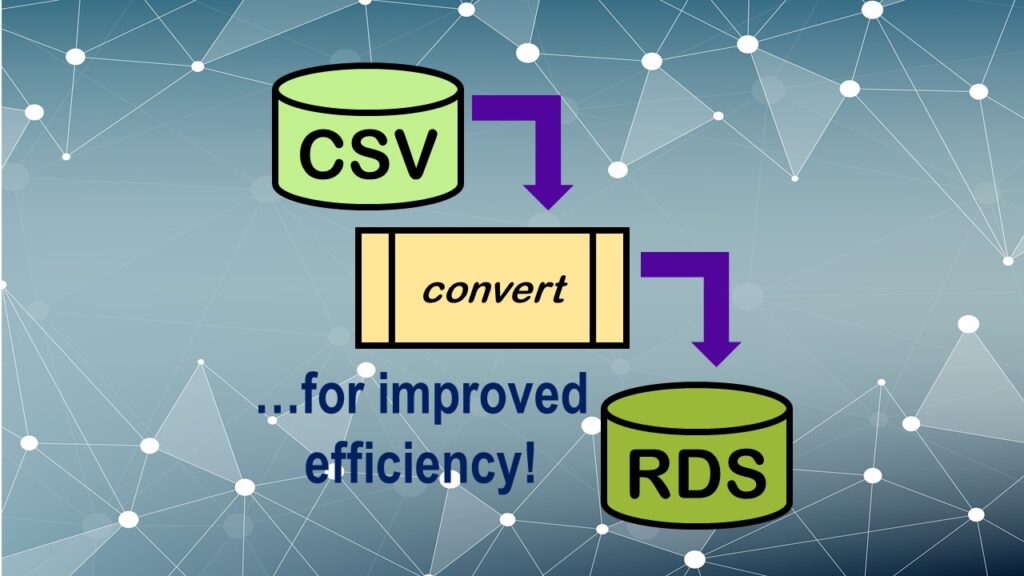
Convert CSV to RDS is what you want to do if you are working with big data files in R GUI and want to improve efficiency. Read my blog post for an explanation and video demonstrations of this process!

16
Mar
Mar
Wondering what we mean by the National Institutes of Health (NIH)? In my blog post, I explain the NIH’s role in appropriating funding for research, and demystify its role in implementing federal priorities.
16
Mar
Mar
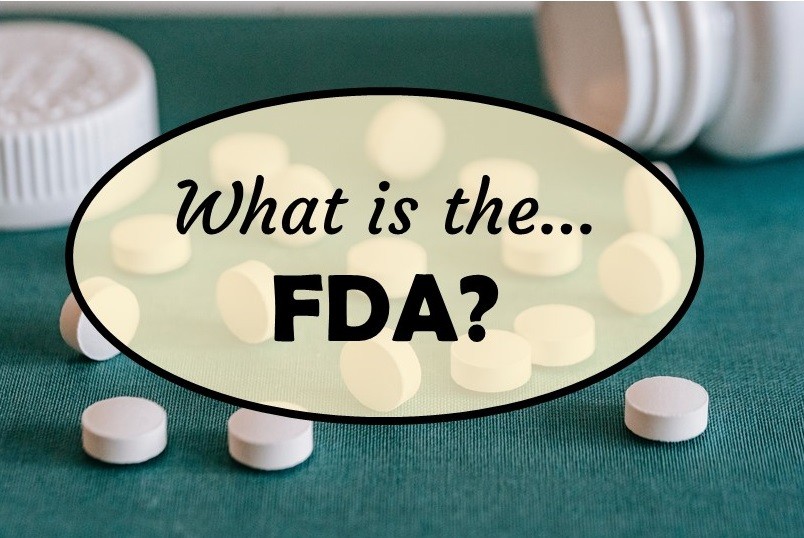
Can you name categories other than “food” and “drugs” that are regulated by the FDA in the US? Read this blog post to learn what they are, and what the FDA does in the US.