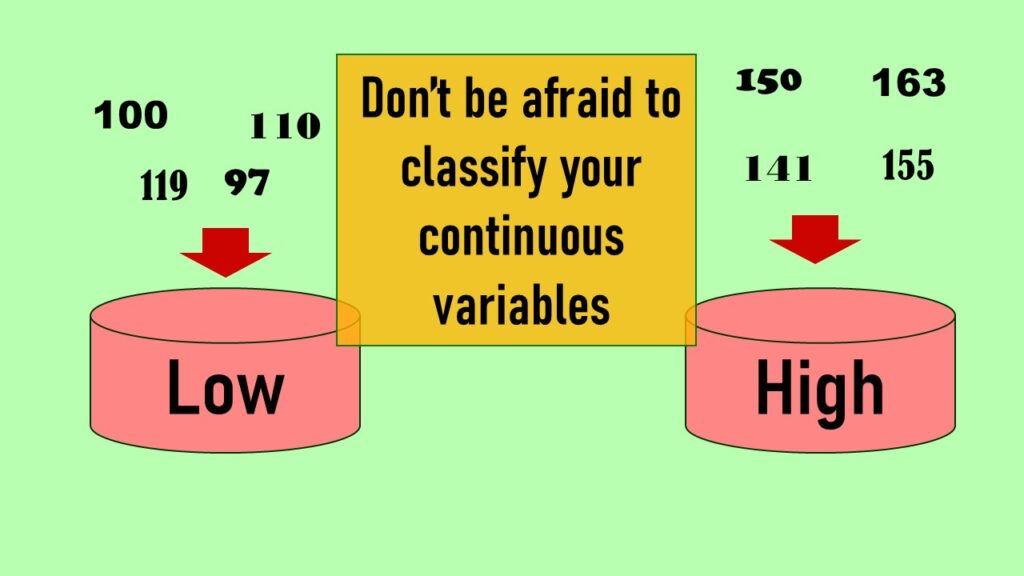
Continuous variable categorized can open up a world of possibilities for analysis. Read about it on my blog!
Tag Archives: case studies
Descriptive analysis of Black Friday Death Count Database provides an example of how creative classification can make a quick and easy data science portfolio project!
Wiley’s predatory behavior recently with a colleague’s scientific manuscript makes me want to avoid publishing in their journals. Read about our experience.
Time series plots in R are totally customizable using the ggplot2 package, and can come out with a look that is clean and sharp. However, you usually end up fighting with formatting the x-axis and other options, and I explain in my blog post.
Interview preparation for data science jobs can involve taking several simple, actionable steps to make yourself feel confident and ready to answer questions with ease. Read my blog post for my tips and tricks!
Counting rows in SAS and R is approached differently, because the two programs process data in different ways. Read my blog post where I describe both ways.
Native formats in SAS and R of data objects have different qualities – and there are reasons behind these differences. Learn about them in this blog post!

