GPower case example shows a use-case where we needed to select an outcome measure for our study, then do a power calculation for sample size required under different outcome effect size scenarios. My blog post shows what I did, and how I documented/curated the results.
Category Archives: Data Science
Posts about data science topics.
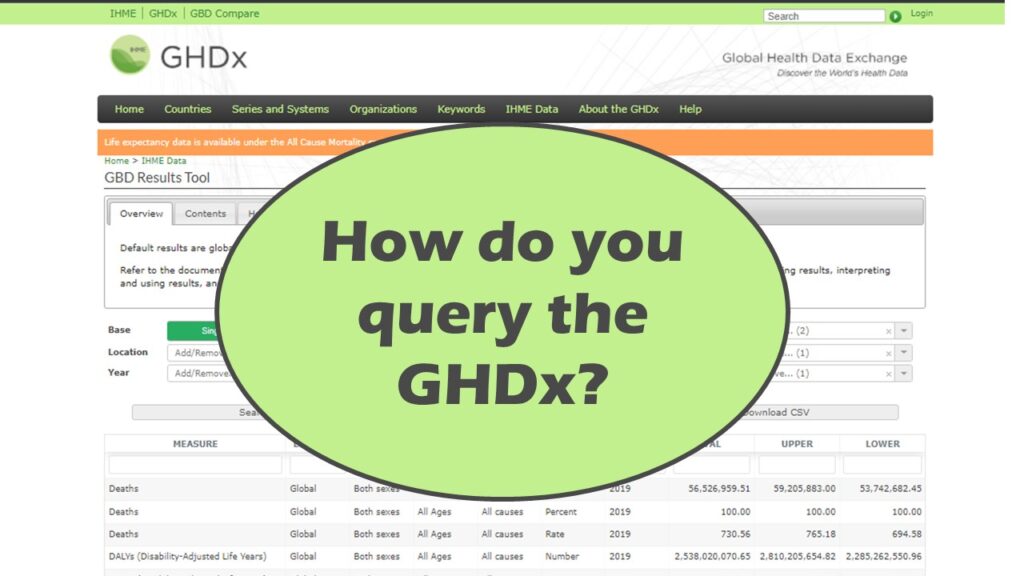
Querying the GHDx database is challenging because of its difficult user interface, but mastering it will allow you to access country-level health data for comparisons! See my demonstration!
Variable names in SAS and R are subject to different “rules and regulations”, and these can be leveraged to your advantage, as I describe in this blog post.
Referring to variables in processing is different conceptually when thinking about SAS compared to R. I explain the differences in my blog post.
Counting rows in SAS and R is approached differently, because the two programs process data in different ways. Read my blog post where I describe both ways.
Native formats in SAS and R of data objects have different qualities – and there are reasons behind these differences. Learn about them in this blog post!
Looking for a SAS-R integration example that uses the best of both worlds? I show you a use-case where I was in a hurry, and did transformation in R with the analysis in SAS!
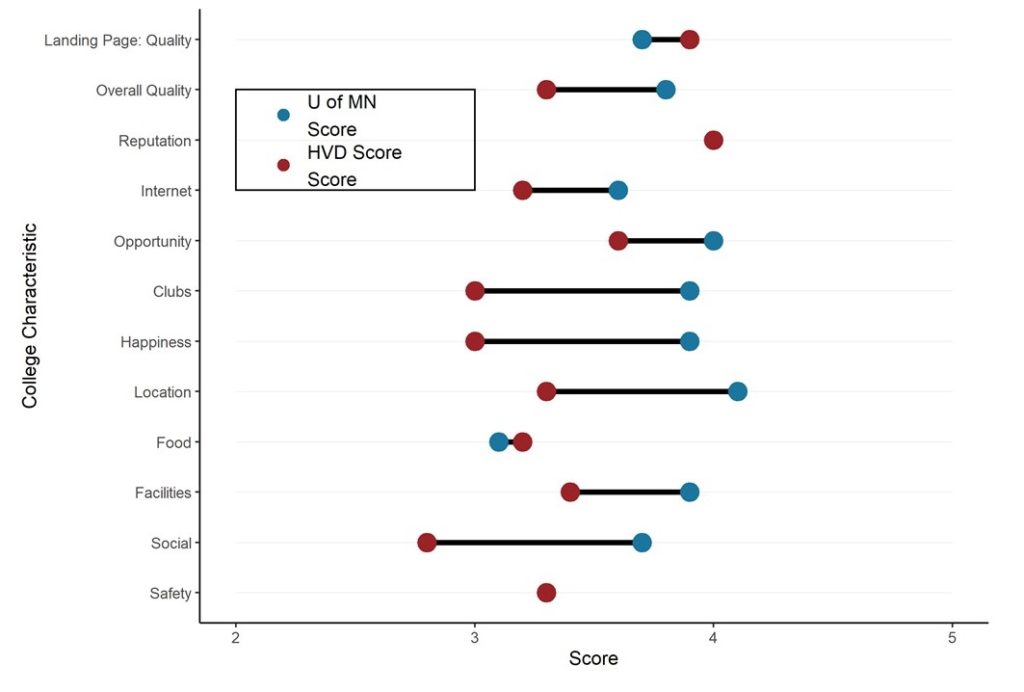
Want to compare multiple rankings on two competing items – like hotels, restaurants, or colleges? I show you an example of using a dumbbell plot for comparison in R with the ggalt package for this exact use-case!
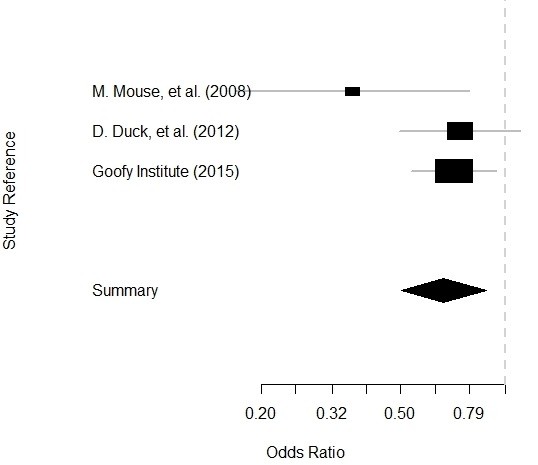
Getting data for meta-analysis together can be challenging, so I walk you through the simple steps I take, starting with the scientific literature, and ending with a gorgeous and evidence-based Forrest plot!
Get to know three of my favorite SAS documentation pages: the one with sort order, the one that lists all the SAS formats, and the one that explains all the SAS operators and expressions!

