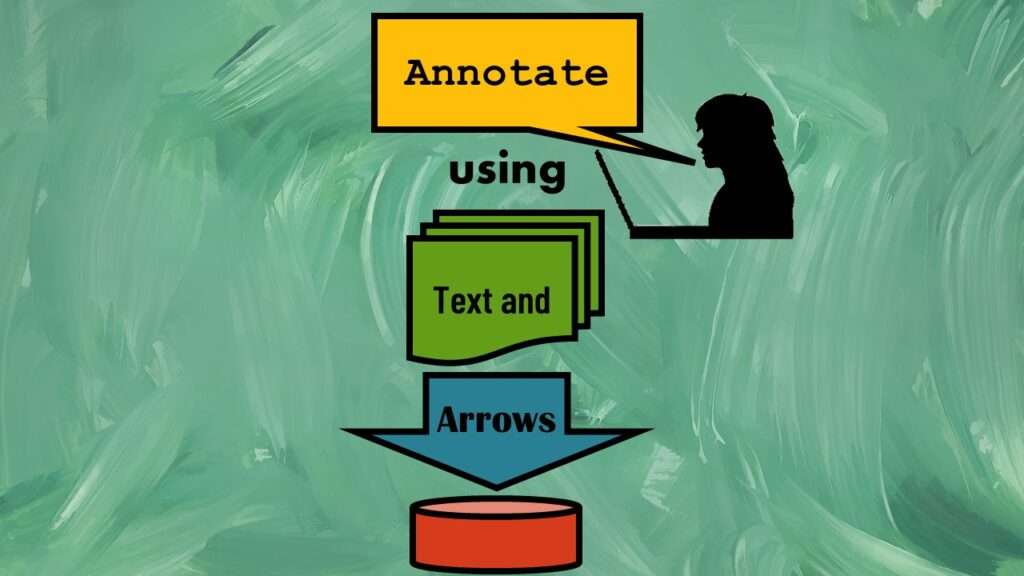
Text and arrows in dataviz, if used wisely, can help your audience understand something very abstract, like a data pipeline. Read my blog post for tips in choosing images for your data visualizations!
Category Archives: Data Science
Posts about data science topics.
01
Oct
Oct
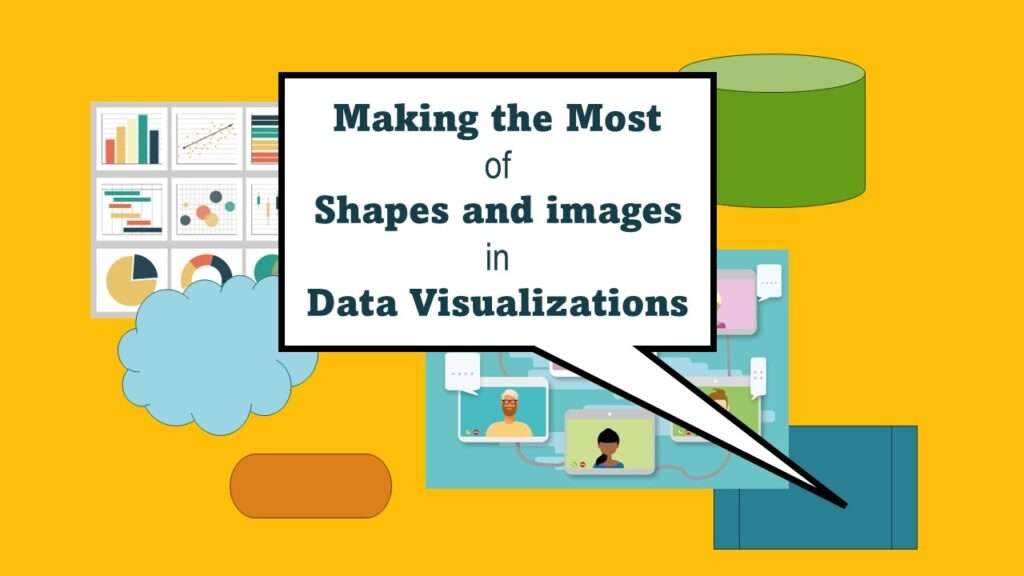
Shapes and images in dataviz, if chosen wisely, can greatly enhance the communicative value of the visualization. Read my blog post for tips in selecting shapes for data visualizations!

24
Aug
Aug
Table editing in R is easier than in SAS, because you can refer to columns, rows, and individual cells in the same way you do in MS Excel. Read my blog post for example R table editing code.
17
Aug
Aug
R for logistic regression in health data analytics is a reasonable choice, if you know what packages to use. You don’t have to use SAS! My blog post provides you example R code and a tutorial!
30
Jul
Jul
Connecting SAS to other applications is often necessary, and there are many ways to do it. Read this blog post for a couple of use-cases of SAS data integration using various SAS components.

13
Jul
Jul
Portfolio project examples are sometimes needed for newbies in data science who are looking to complete independent projects. This blog post provides some great examples of independent projects you can do with datasets available online!

25
Jun
Jun
Project management terminology is often used around epidemiologists, biostatisticians, and health data scientists, and it’s often hard for us to admit we aren’t familiar with some of the terms. Watch my videos and take my Applications Basics course to get up to speed with vocabulary from the health application development domain.

22
Jun
Jun
“Rapid application development” (RAD) refers to an approach to designing and developing computer applications. In public health and healthcare, we are not taught about application development – but it’s good for us to learn about it, since we have to deal with data from health applications. My blog post talks about the RAD approach I […]

19
Jun
Jun
Understanding legacy data is necessary if you want to analyze datasets that are extracted from old systems. This knowledge is still relevant, as we still use these old systems today, as I discuss in my blog post.
16
Jun
Jun
Front-end decisions are made when applications are designed. They are even made when you design a survey in SurveyMonkey. What health data analysts often don’t realize is that these decisions have a profound impact on the quality and accuracy of the data that are collected through these front-ends, which is the focus of this blog […]