Tag Archives: academic coaching

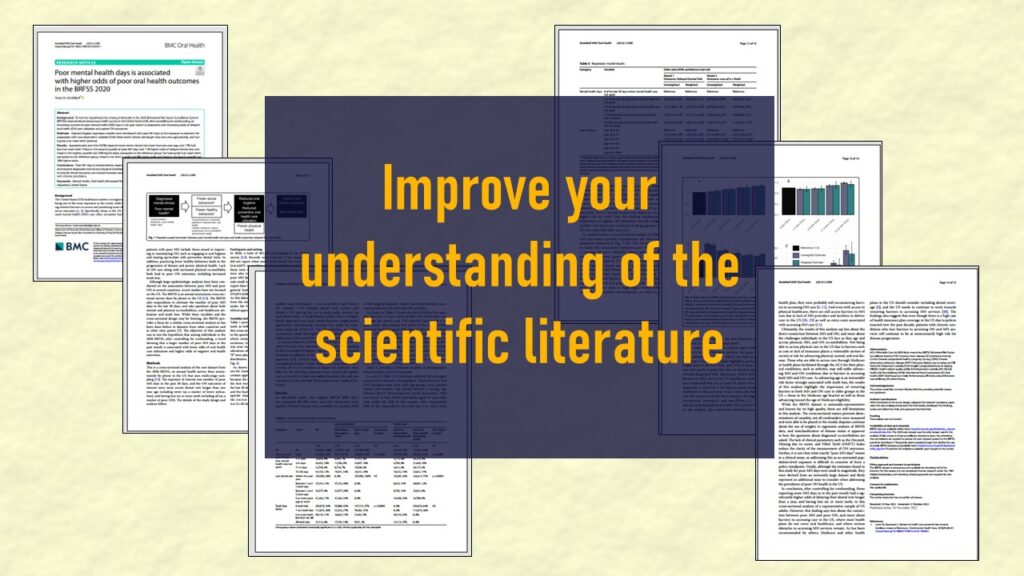
CDC Wonder for Studying Vaccine Adverse Events: The Shameful State of US Open Government Data

The open government data movements in many countries have resulted in government data being available online.

CDC Wonder is an online query portal that serves as a gateway to many government datasets. Although antiquated, it still works for extracting data, and my blog post shows you how.

Classification Crosswalks: Strategies in Data Transformation

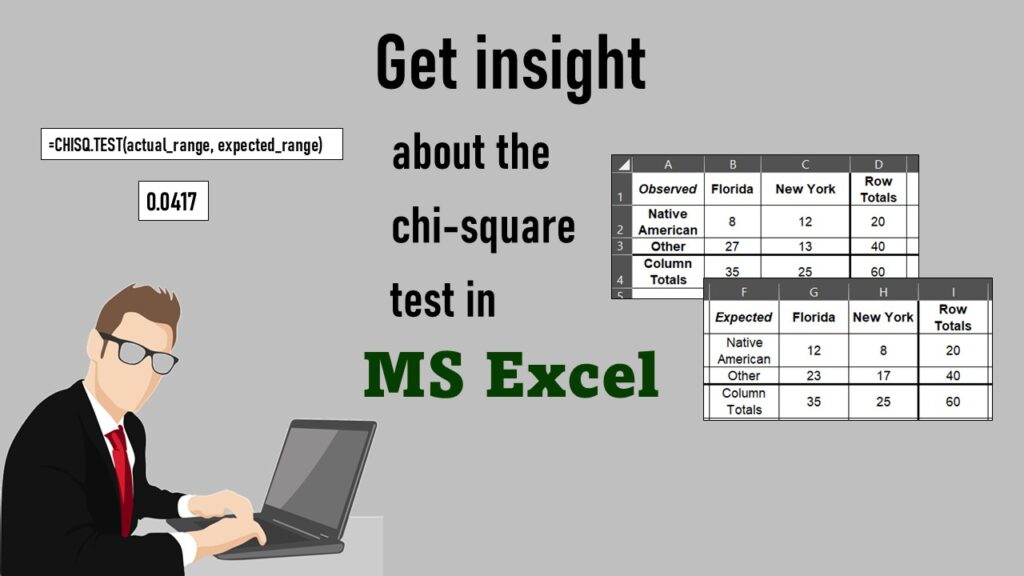
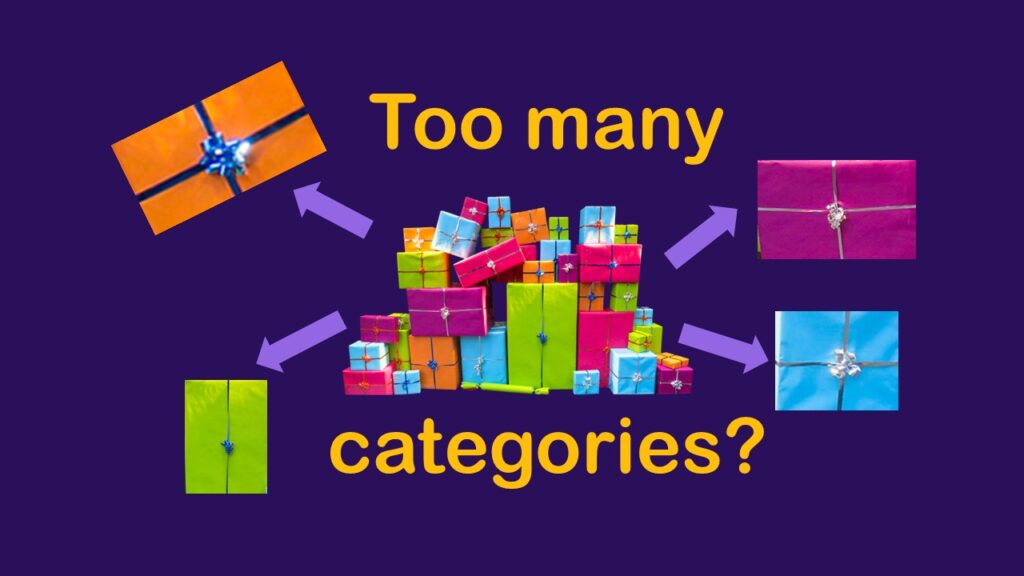
What if you have too many categories in a categorical variable? Your cardinality is too high for a chi-square analysis.

Classification crosswalks are easy to make, and can help you reduce cardinality in categorical variables, making for insightful data science portfolio projects with only descriptive statistics. Read my blog post for guidance!

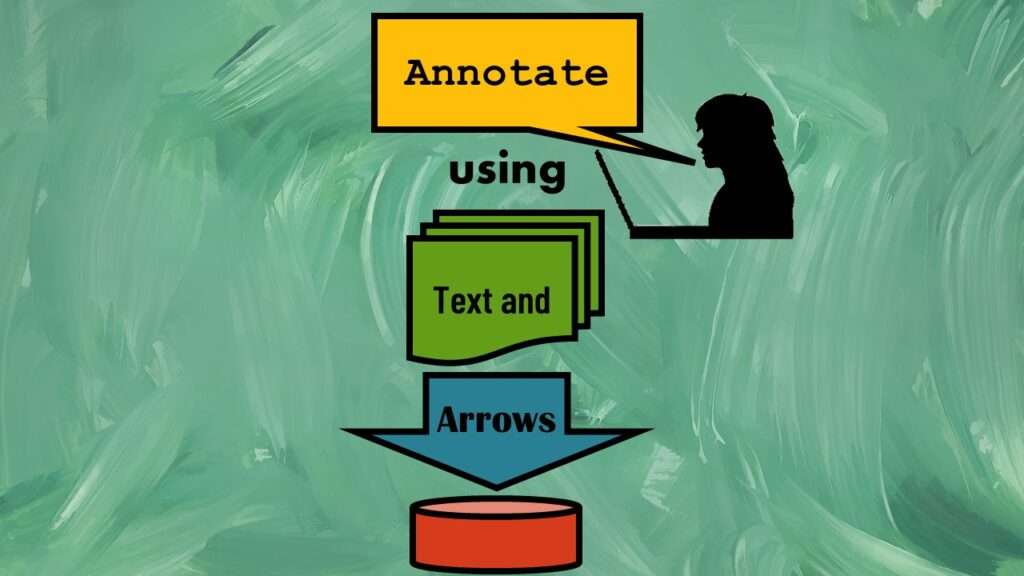
Text and Arrows in Dataviz Can Greatly Improve Understanding

Adding text and arrows to diagrams can help your audience navigate the image, and understand what you are trying to communicate.

Text and arrows in dataviz, if used wisely, can help your audience understand something very abstract, like a data pipeline. Read my blog post for tips in choosing images for your data visualizations!

Connecting SAS to Other Applications: Different Strategies

Did you know it is possible to integrate SAS with other data environments, like Microsoft SQL or Excel?

Connecting SAS to other applications is often necessary, and there are many ways to do it. Read this blog post for a couple of use-cases of SAS data integration using various SAS components.

Portfolio Project Examples for Independent Data Science Projects

Are you a data scientist who is interested in doing independent portfolio projects to sharpen your skills? Then I strongly suggest you get a coach or a mentor.

Portfolio project examples are sometimes needed for newbies in data science who are looking to complete independent projects. This blog post provides some great examples of independent projects you can do with datasets available online!

Management Tips for Data Scientists

When working in data science, there are some tips and tricks to managing your communication and relationship with superiors that can help you advance in your career.

Management tips for data scientists can be used by anyone – at work and in your personal life! Get the details in my blog post.

WISE Summit 2023: Women Leaders “Created by Courage”

For the WISE 2023 Summit at Northeastern University in Boston, Monika hosted a business intelligence workshop.

WISE Summit 2023 at Northeastern University was the biggest and best one so far! I was honored to lead a business intelligence workshop, as I talk about in my blog post.

CitePeeps: Want to Increase Citations to Your Research? Join our Online Community!

CitePeeps is an online community of scientific authors who are interested in increasing the number of citations to their written works.

CitePeeps is a new online community of scientific authors focused on increasing the number of citations to their published works. Join us!

GitHub Beginners in Data Science: Here’s an Easy Way to Start!

If you are an aspiring data scientist, you will need to know how GitHub works. You will probably want to use it for your projects.

GitHub beginners – even in data science – often feel intimidated when starting their GitHub accounts and trying to interact with the web page. Don’t be shy! Catch the highlights from a recent GitHub beginners workshop I held!

Benchmarking Runtime is Different in SAS Compared to Other Programs

How do you measure how long it takes for code to run in different programs? And why would you want to measure something like that? Mainly, the reason to benchmark runtime is so that you can figure out how to optimize your code.

Benchmarking runtime is different in SAS compared to other programs, where you have to request the system time before and after the code you want to time and use variables to do subtraction, as I demonstrate in this blog post.

Verified by MonsterInsights